Pynq-Based Alpha Scintillator DAQ and Fun with Radon (Work in Progress)
GitHub Link
Introduction
I'll admit that for the past couple of years I've been in a bit of a slump. I think a lot of people have with the pandemic and everything else that has been going on in the world. But I've finally found myself emerging from it, and along with that, my mind has been brimming over with ideas for projects and experiments. I haven't had nearly as much time as I want to work on projects, but I did finally get started on one of the stranger project ideas that's been on the back of my mind for almost 3 years now.
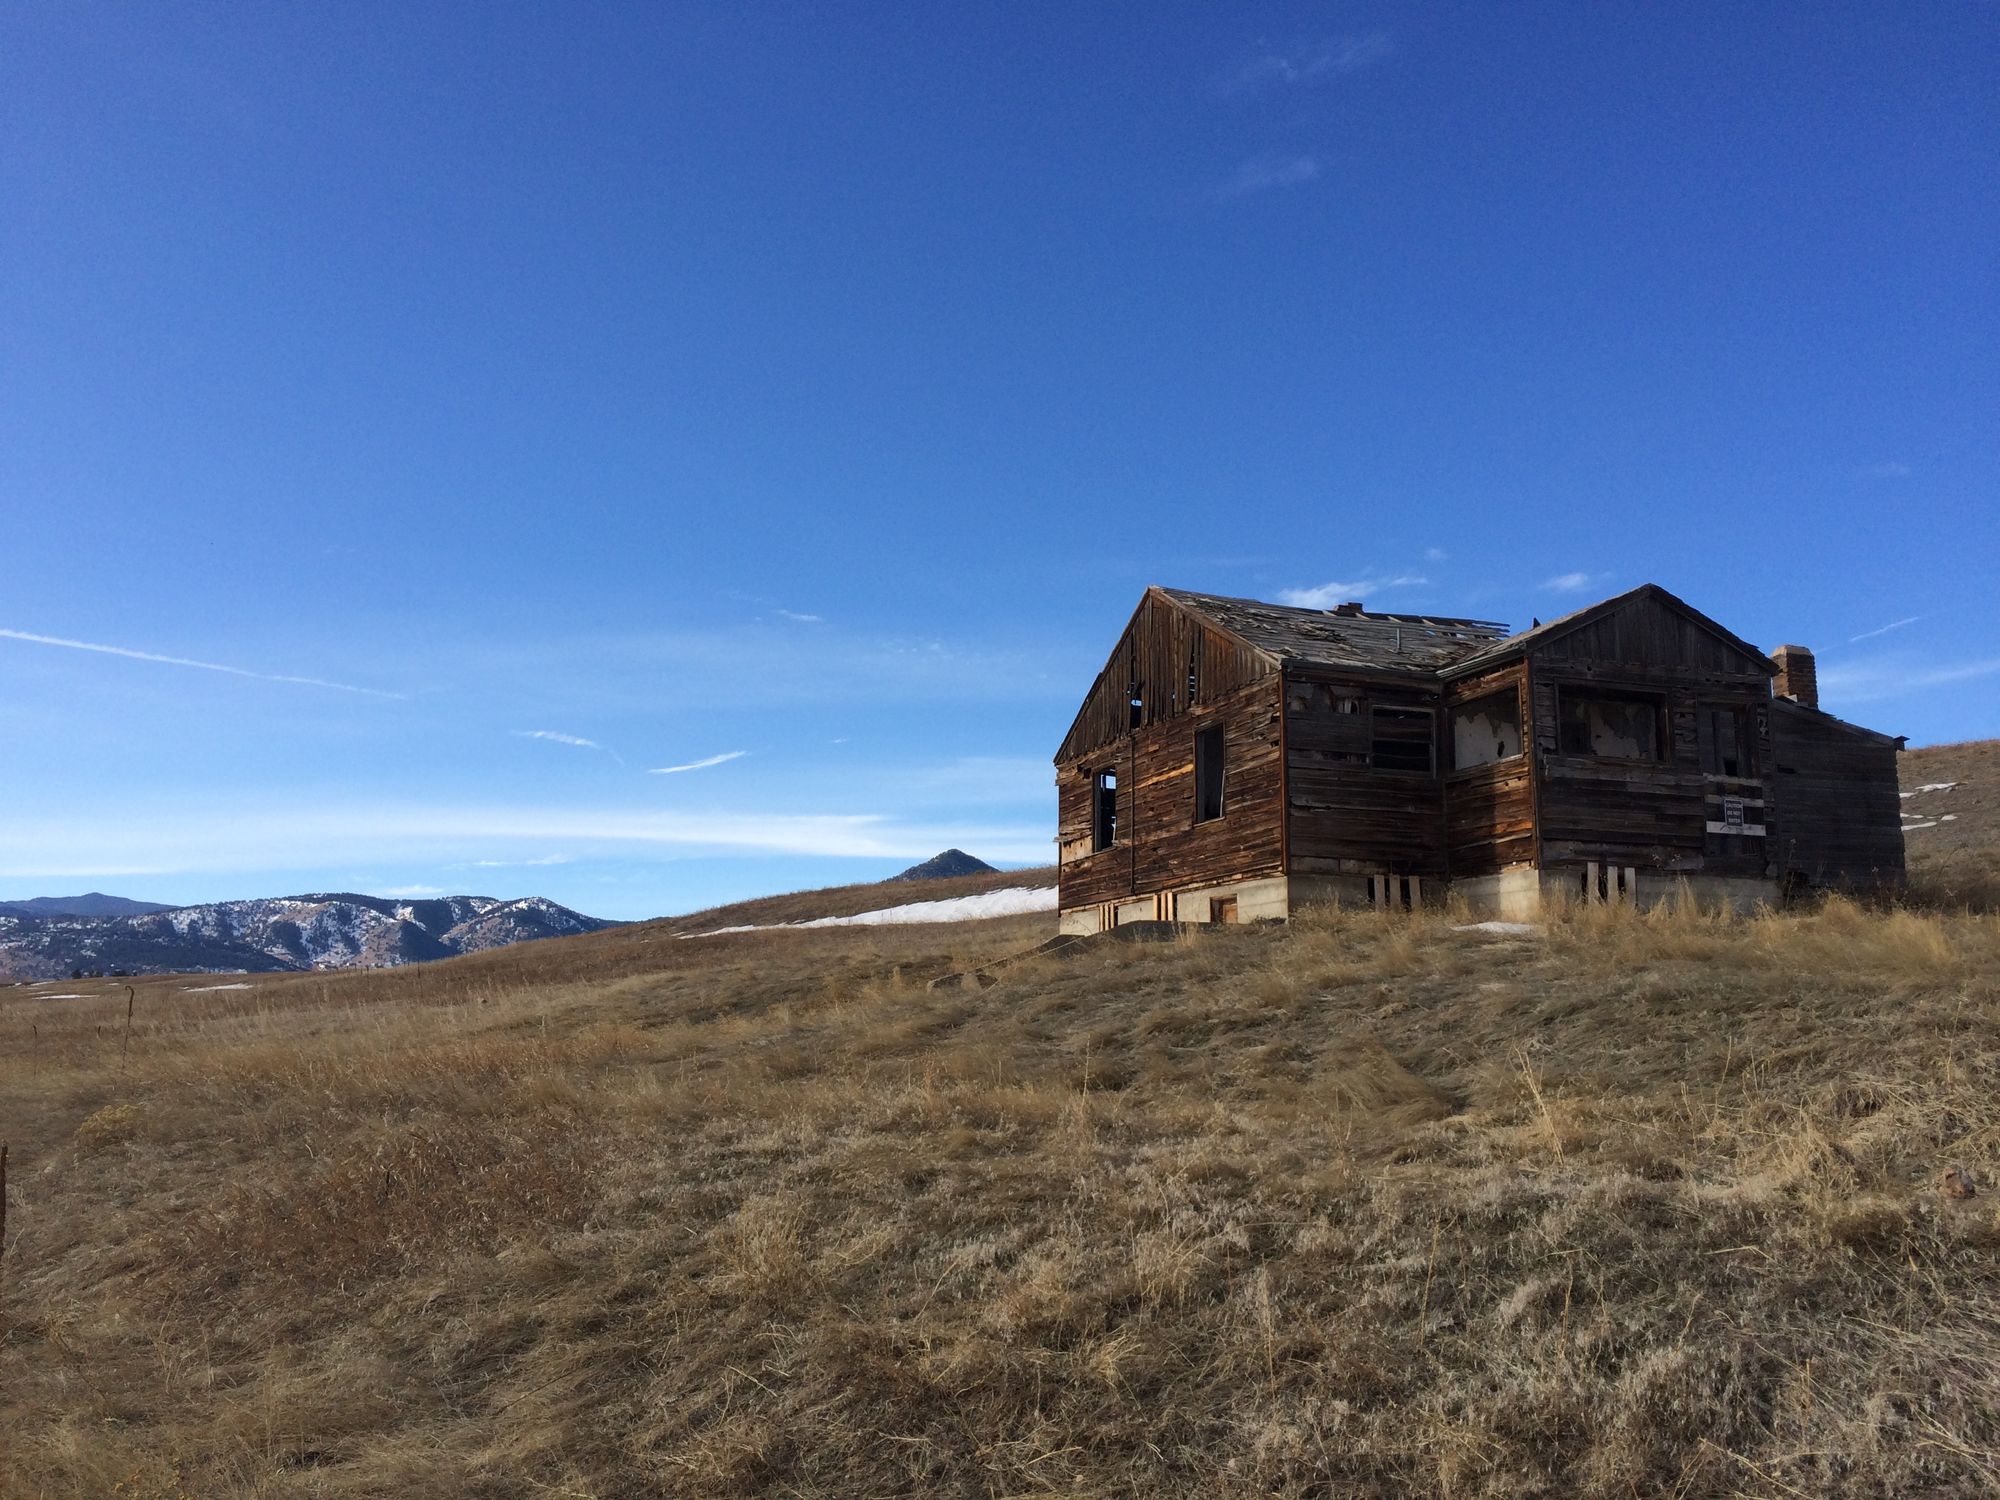
Back in December 2019, I was visiting my parents in Colorado for Winter break. At the time, I was going into my last semester of college, wrapping up a degree in physics and nuclear science. I was looking into places to go hiking near Denver, when I saw that Rocky Flats had just opened a large area to the public (the DOE legacy site in the center is permanently closed). I personally don't doubt that the cleanup effort was sufficient, but I thought it would be fun to bring a radiation detector and take some measurements. The only detector I had at the time was a NaI(Tl) scintillator (most of my detectors were back in Massachusetts), which is only sensitive to gamma radiation. That sort of detector is not well suited to measure the plutonium contamination that was present at Rocky Flats, but I was really just messing around. I did find some interesting trends in background levels based on topography, but nothing to indicate measurable contamination, which is good because I personally find Rocky Flats to be a beautiful location (for the record, I stayed on trail and followed all posted guidelines, and intend to continue doing so in the future).
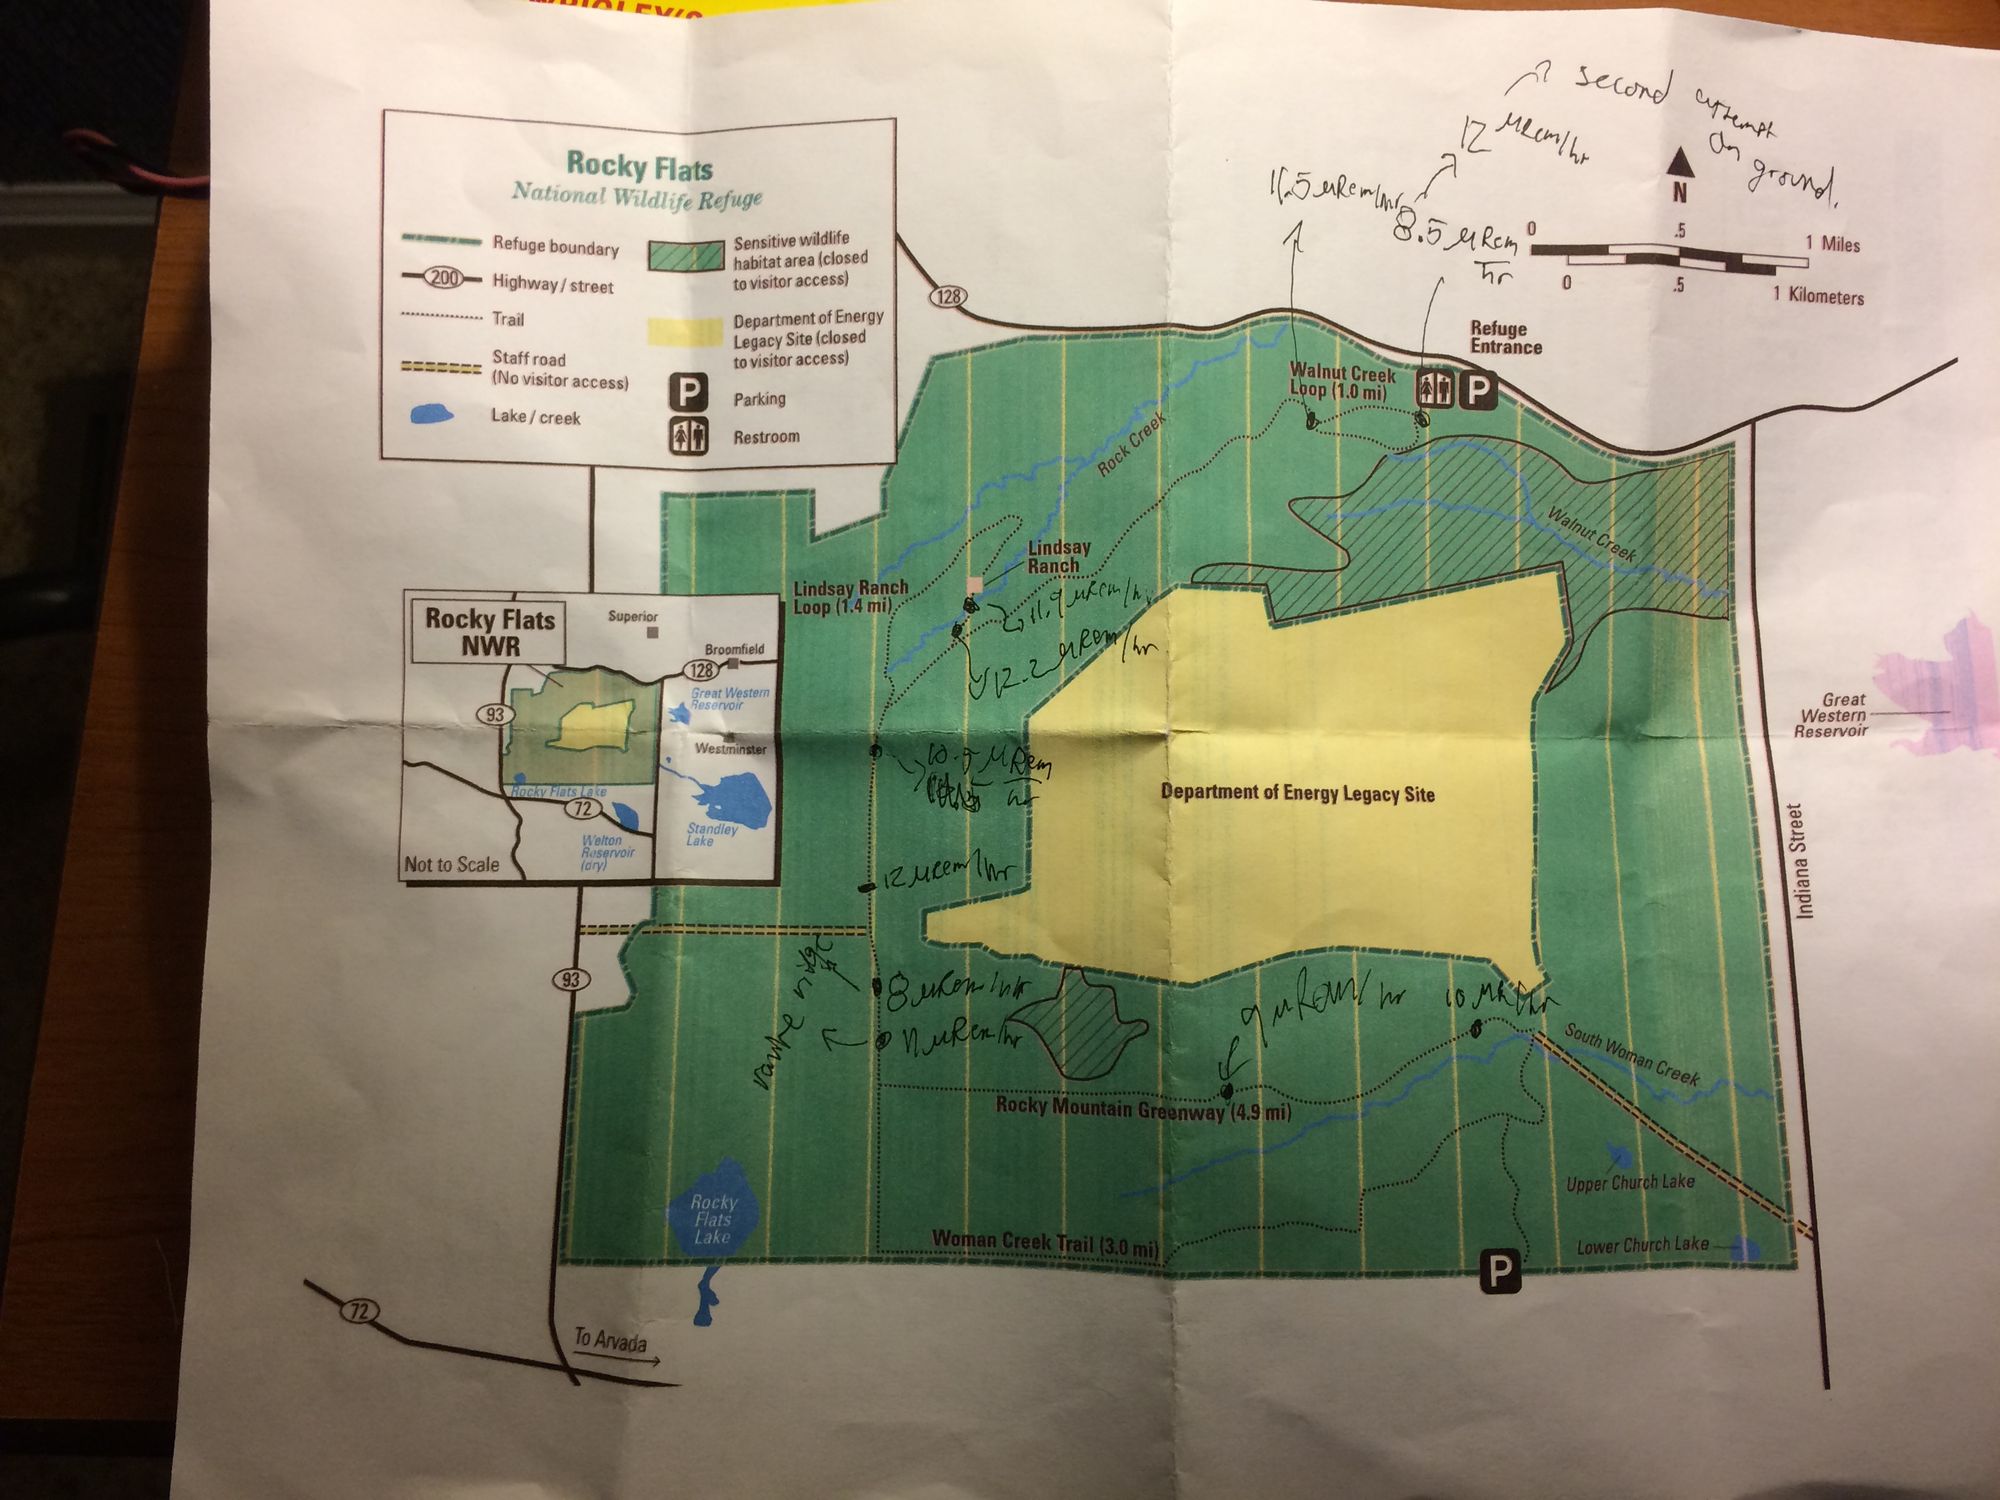
Nevertheless, ever since then, I have been fascinated by Rocky Flats, and that experience really got me thinking about what sort of experiment I could do to truly determine if I was exposing myself to any contamination simply by hiking through the wildlife refuge and following posted guidelines. Reading through the reviews of the hiking trails, there are certainly a lot of individuals out there who think radiation exposure is a problem there. I don't think anything could convince them it isn't, but it does make for a good exercise in experimental design.
Because the main contamination at the site was plutonium, which is an alpha-emitter, any exposure to the contamination would come from ingesting or, more likely, inhaling dust while on site. Experiencing the pandemic probably helped me realize this, but a sample of dust you would have inhaled on a hike could be easily collected by simply wearing an N95 mask while on site. You could then measure any material collected in the mask in a more controlled environment with a detector that's really up to the task.
It just so happens that I think I do already have an appropriate detector for this experiment that I nabbed off Ebay when I was a teenager, but I didn't really have the electronics to power it or a good data acquisition system to run any experiments, which I expect will require days or weeks of integration time since the signal is going to be tiny if not non-existent. Developing these components and characterizing the detector's sensitivity so that I can perform the experiment described above is what this project is all about.
As the title says, this project is still very much a work in progress, so expect this post to change significantly in the coming months. I expected this project to be straightforward, but it's already taken me on some twists and turns I didn't expect. Every project is a journey, I suppose, which is all part of the fun.
Some Background Information on the Detector
Back in high school, I had a bit of an obsession with using the little spending money I had to buy inexpensive lab equipment on the surplus market to run various physics experiments. That's a pretty strange sentence now that I read it back, but there are certainly worse things to get into as a teenager.
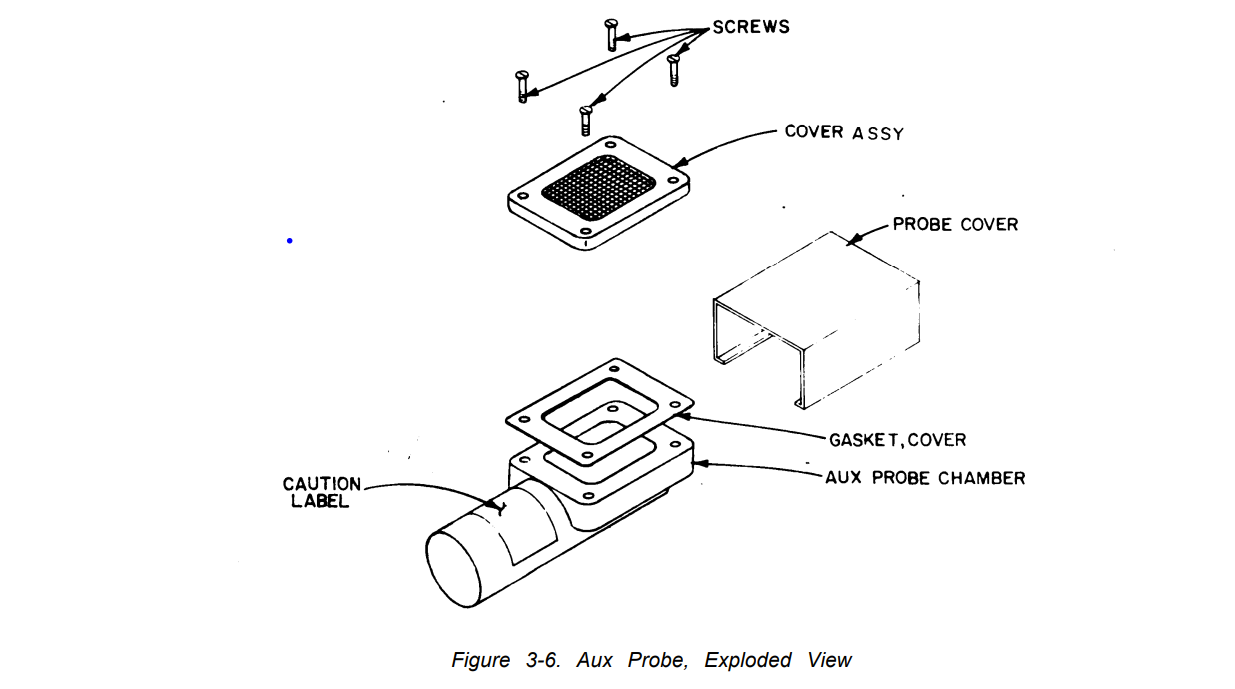
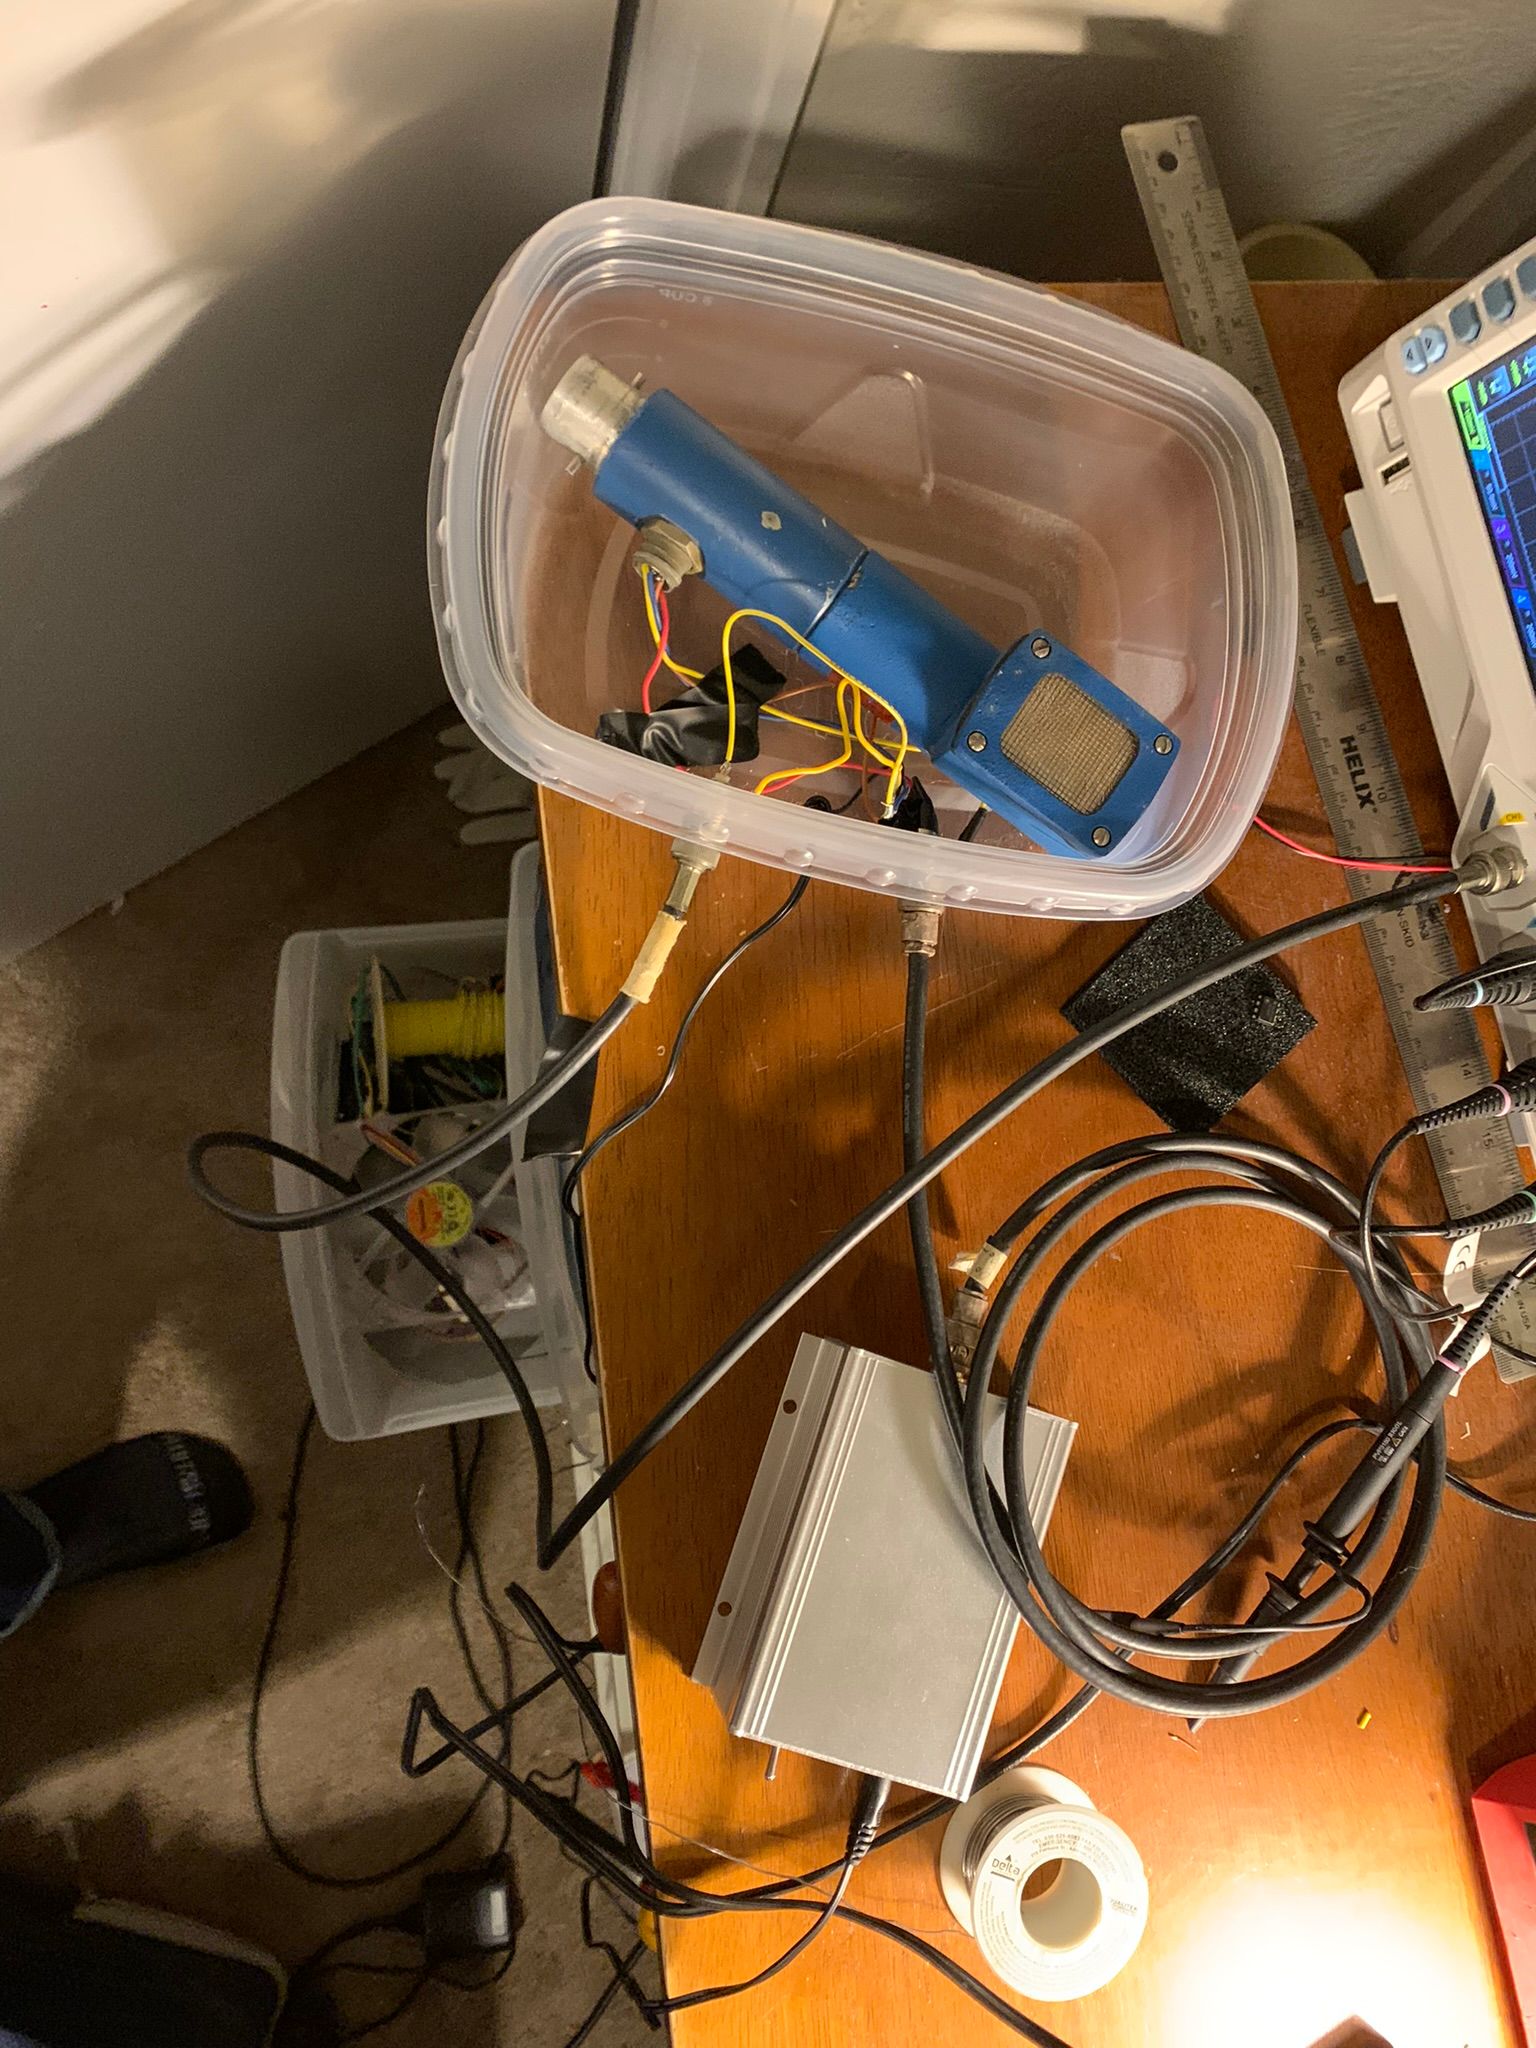
Anyway, one of the things I got my hands on was an army surplus AN-56F alpha scintillator, which consists of a thin, aluminized Mylar window with a coating of ZnS(Ag) on the backside and a photomultiplier tube right behind it. The detector tube also has a built in preamp, which makes using it a bit easier. The detector I have is the smaller "auxillary" detector, which fits onto the same PMT assembly as the main detector, but with a smaller, ~1.5"x1.25" scintillator window. The whole system has a shockingly complete repair manual circulating the internet. The manual does have some rather strange...we'll call them "vestiges" of the 1970s, but it comes complete with technical drawings, detailed descriptions of operating principles, and full schematics. Does that count as open source hardware?
So, why is this thing the perfect detector to measure extremely low levels of alpha-emitting contamination? Well, for one thing, it was designed to detect breaches in plutonium warheads, which is a genuinely terrifying sentence to commit to words, but that does mean it was specifically designed to measure the material released at Rocky Flats. In a more general sense, these sorts of alpha scintillators have fantastic gamma rejection. Because gamma particles are generated from natural terrestrial sources and can penetrate most materials, gamma radiation, in some amount, is omnipresent on the surface of the earth. For this reason, gamma detectors are very sensitive to background. My workhorse 1.5"x3" NaI(Tl) detector measures 5-10 thousand counts per minute from background, just to give you an idea. It is still possible to measure low concentrations of materials using gamma spectroscopy, but it requires shielding the detector with large amounts of lead, using long integration time, and careful background subtraction. Even then, I'm anticipating signals that could be lower as 1 count per hour. Gamma background would wash out such a signal even in the best system. So, it is imperative that whatever detector I use will not be effected by gamma background even a little bit. Plus, I'm trying to measure plutonium contamination (see the intro), which really doesn't emit much in the way of gamma particles but does emit alphas. Because alphas are so charged they get stopped by just a few centimeters of air, so there is virtually no source of alpha background capable of reaching the detector during a measurement except for whatever radon happens to be in the air a few centimeters away from the detector window (more on that later...). All this to say, these alpha scintillators are very sensitive to alpha particles, which we are trying to measure, while having almost no sensitivity to background radiation that could interfere with our measurement.
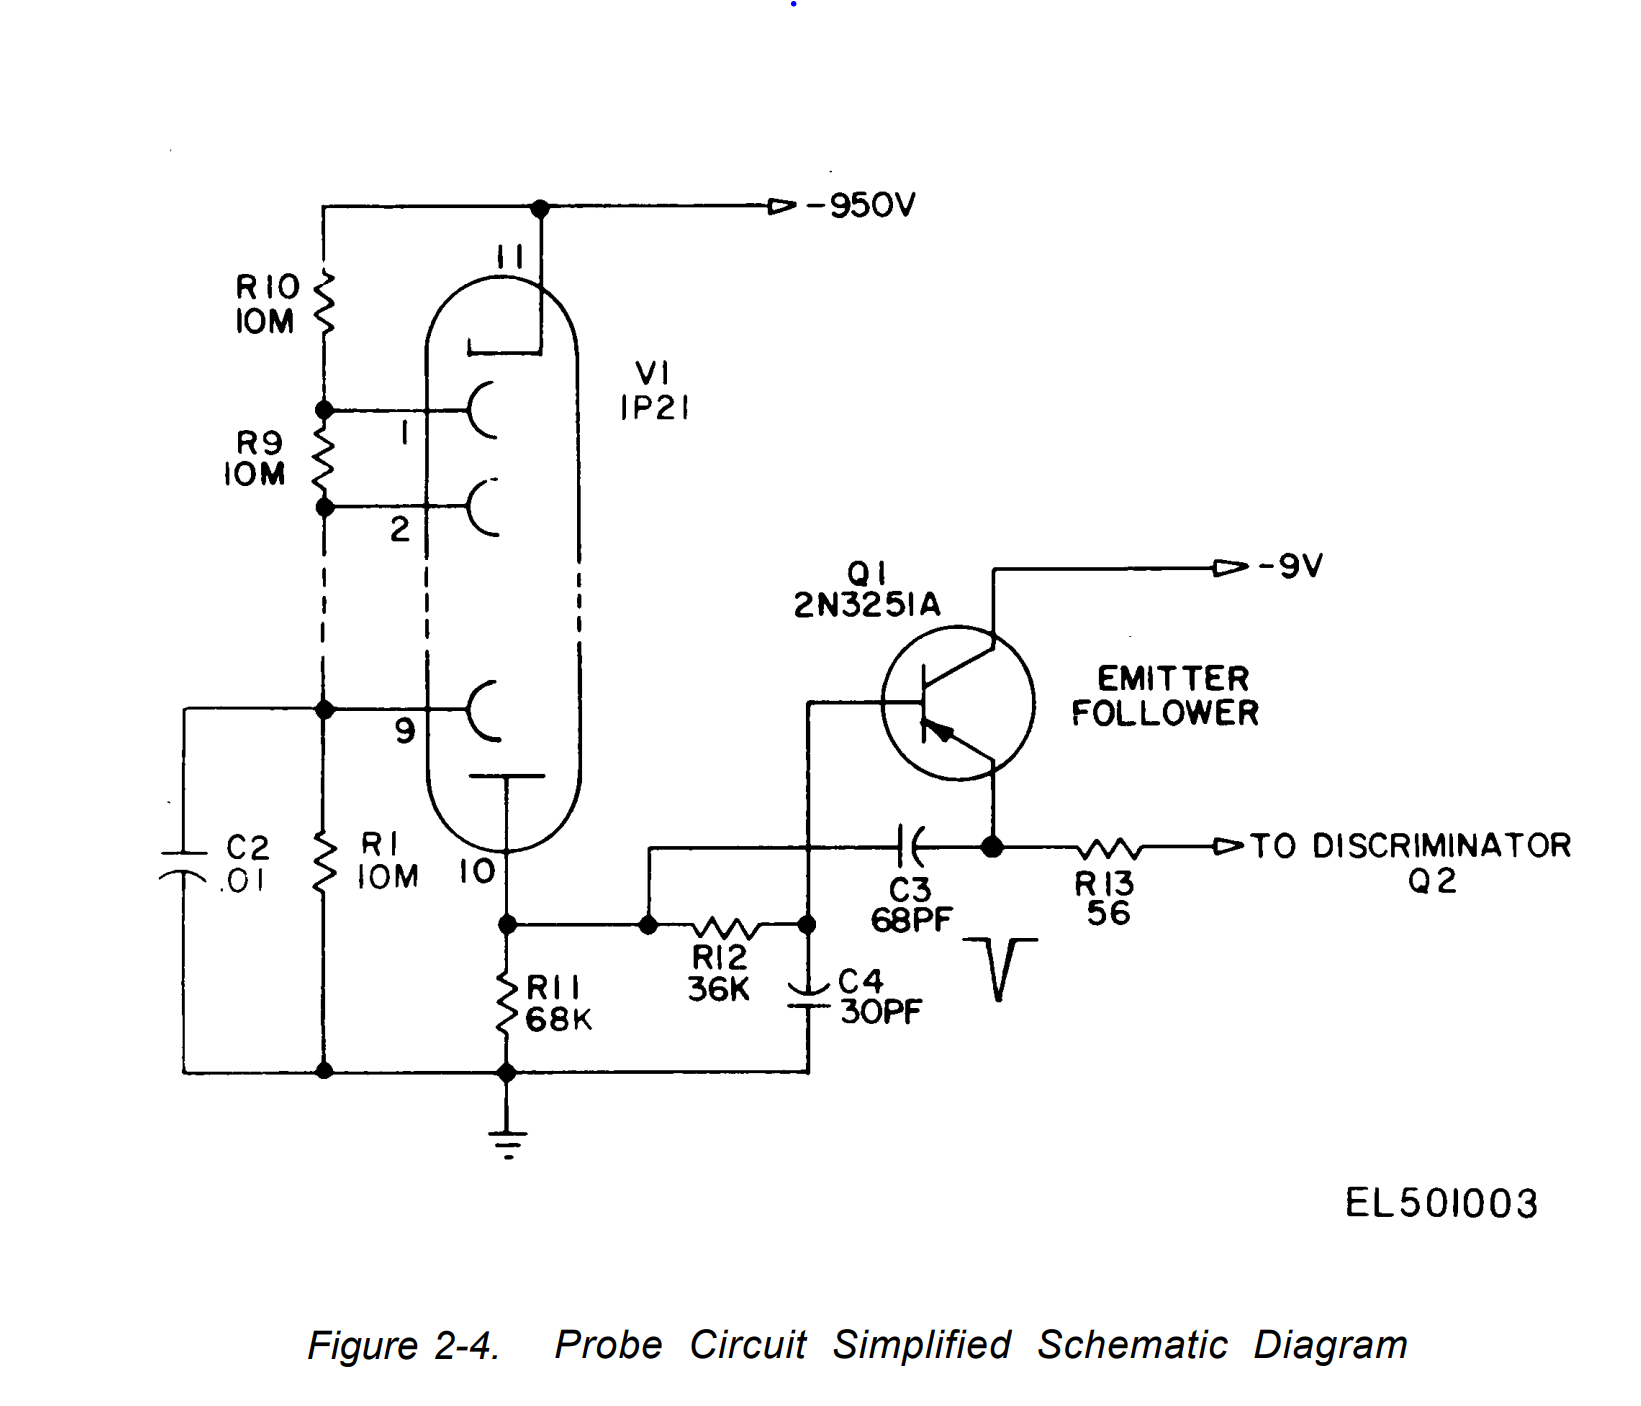
According to the repair manual, the PMT requires -950V, and its integrated preamp requires -9V, and to top it all off, the output pulse from the preamp is also negative. There's technically nothing wrong with that, and plenty of modern analog circuits use split or negative voltage rails, but it makes it a bit harder to source a high voltage power supply. Not that I have easy access to one anyways. I used to have a nice high voltage supply that fit into a NIM crate in college, but I abandoned it along with most of my other dumpster-dived treasures during the COVID evacuation. So, I built a new one specifically for this experiment.
Building the High Voltage Power Supply
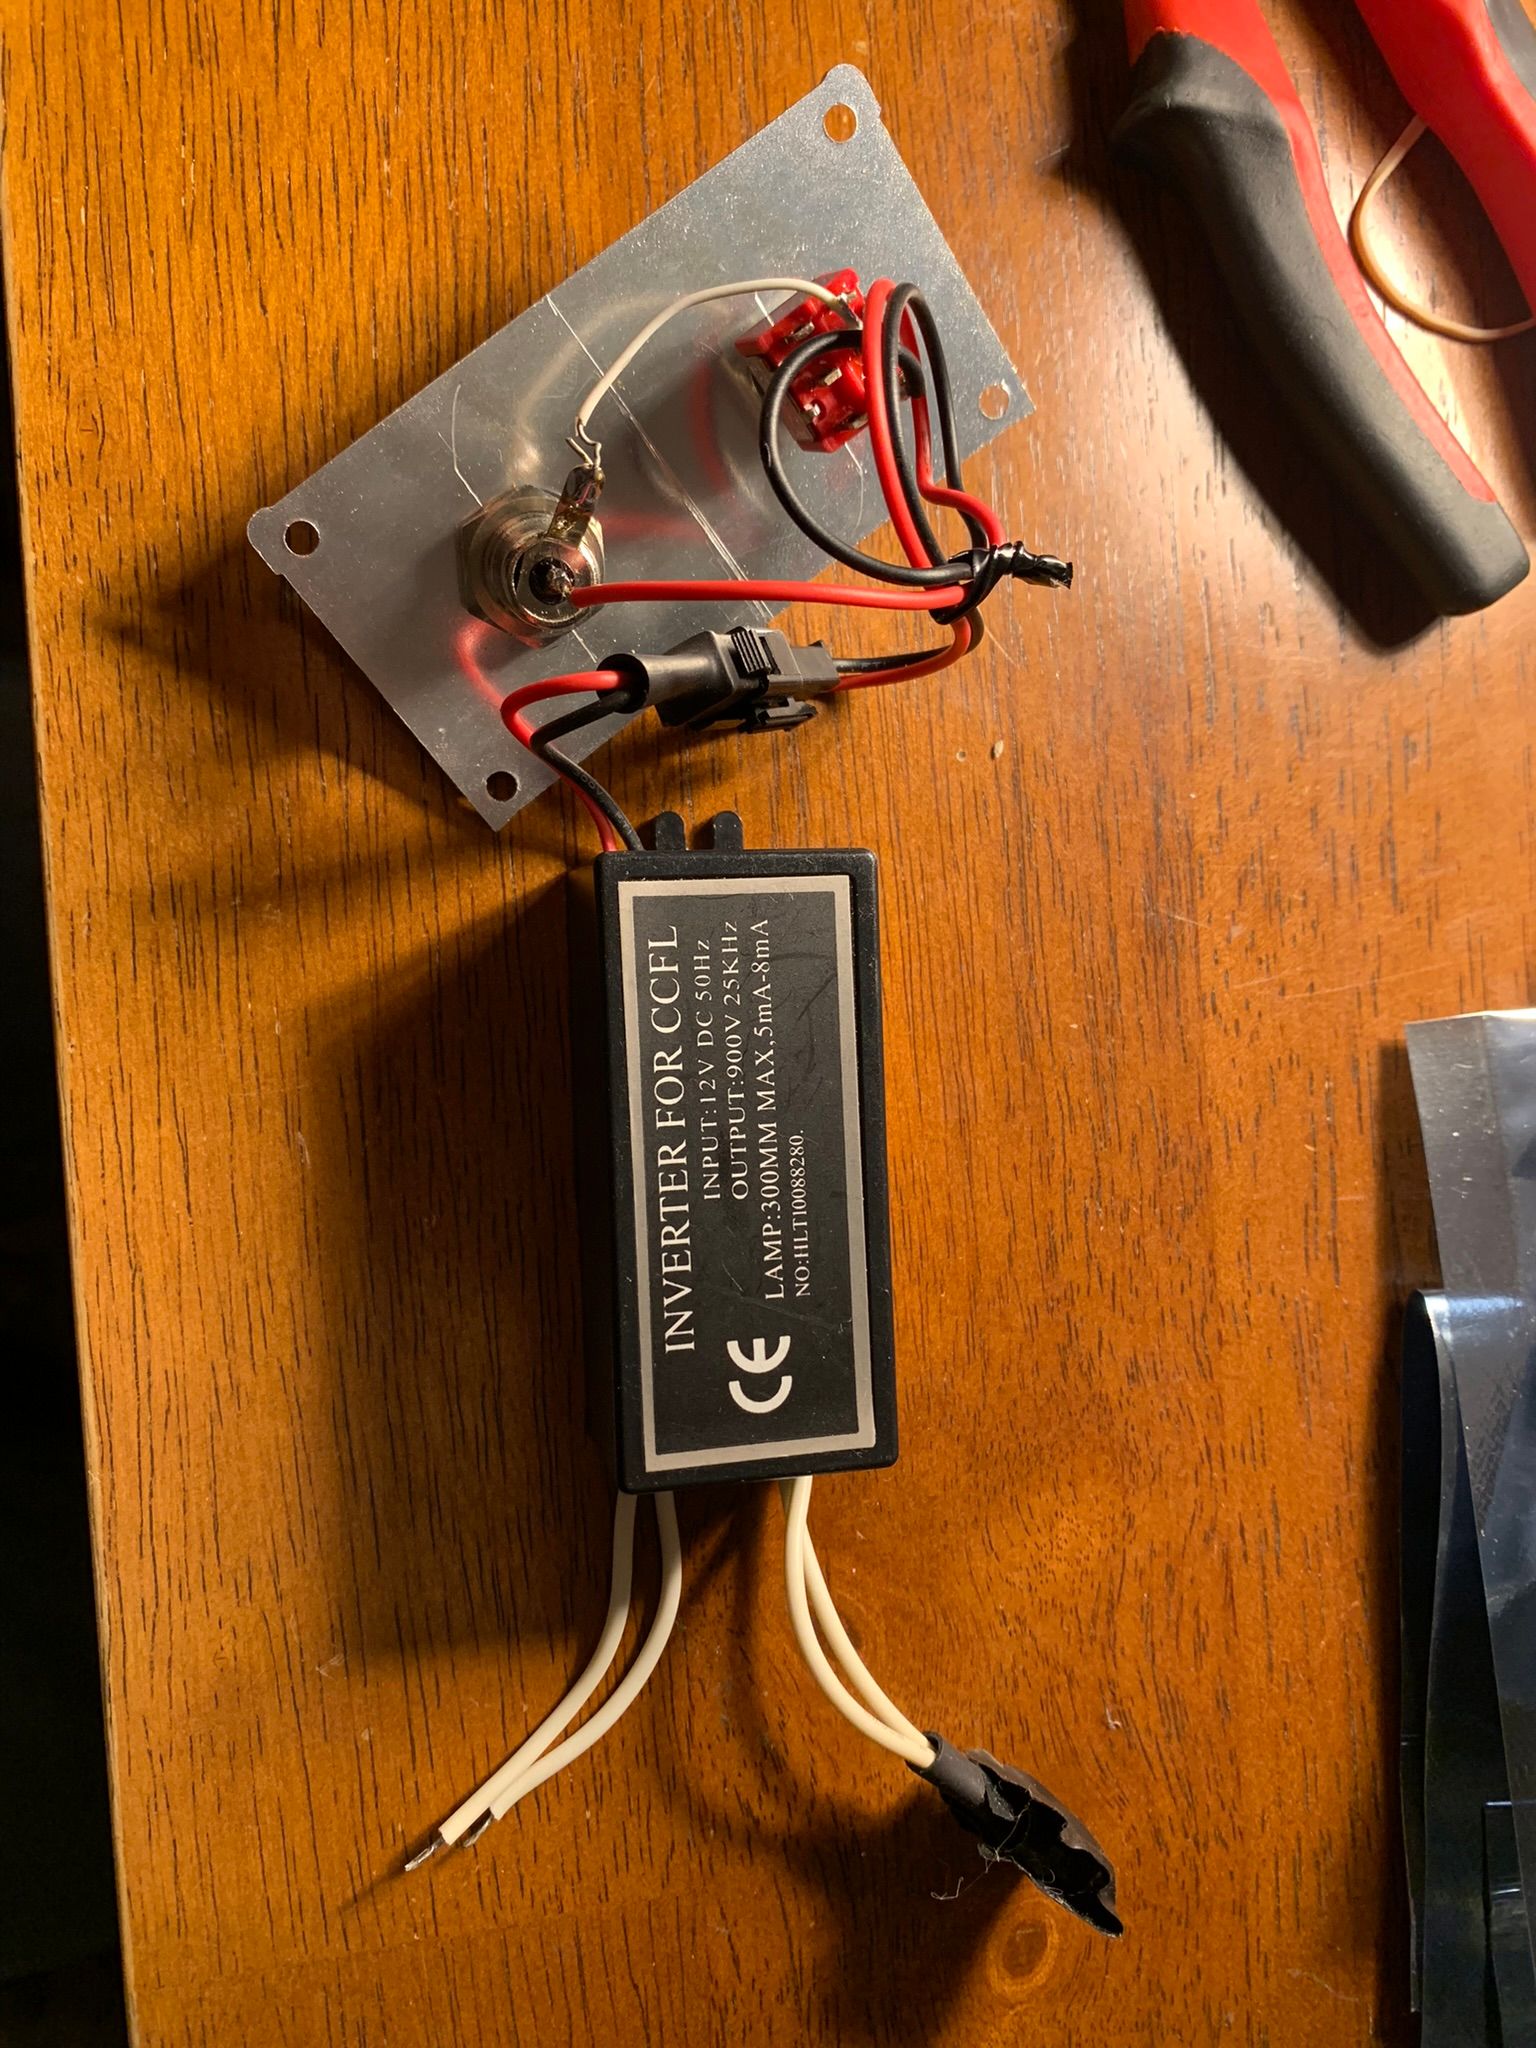
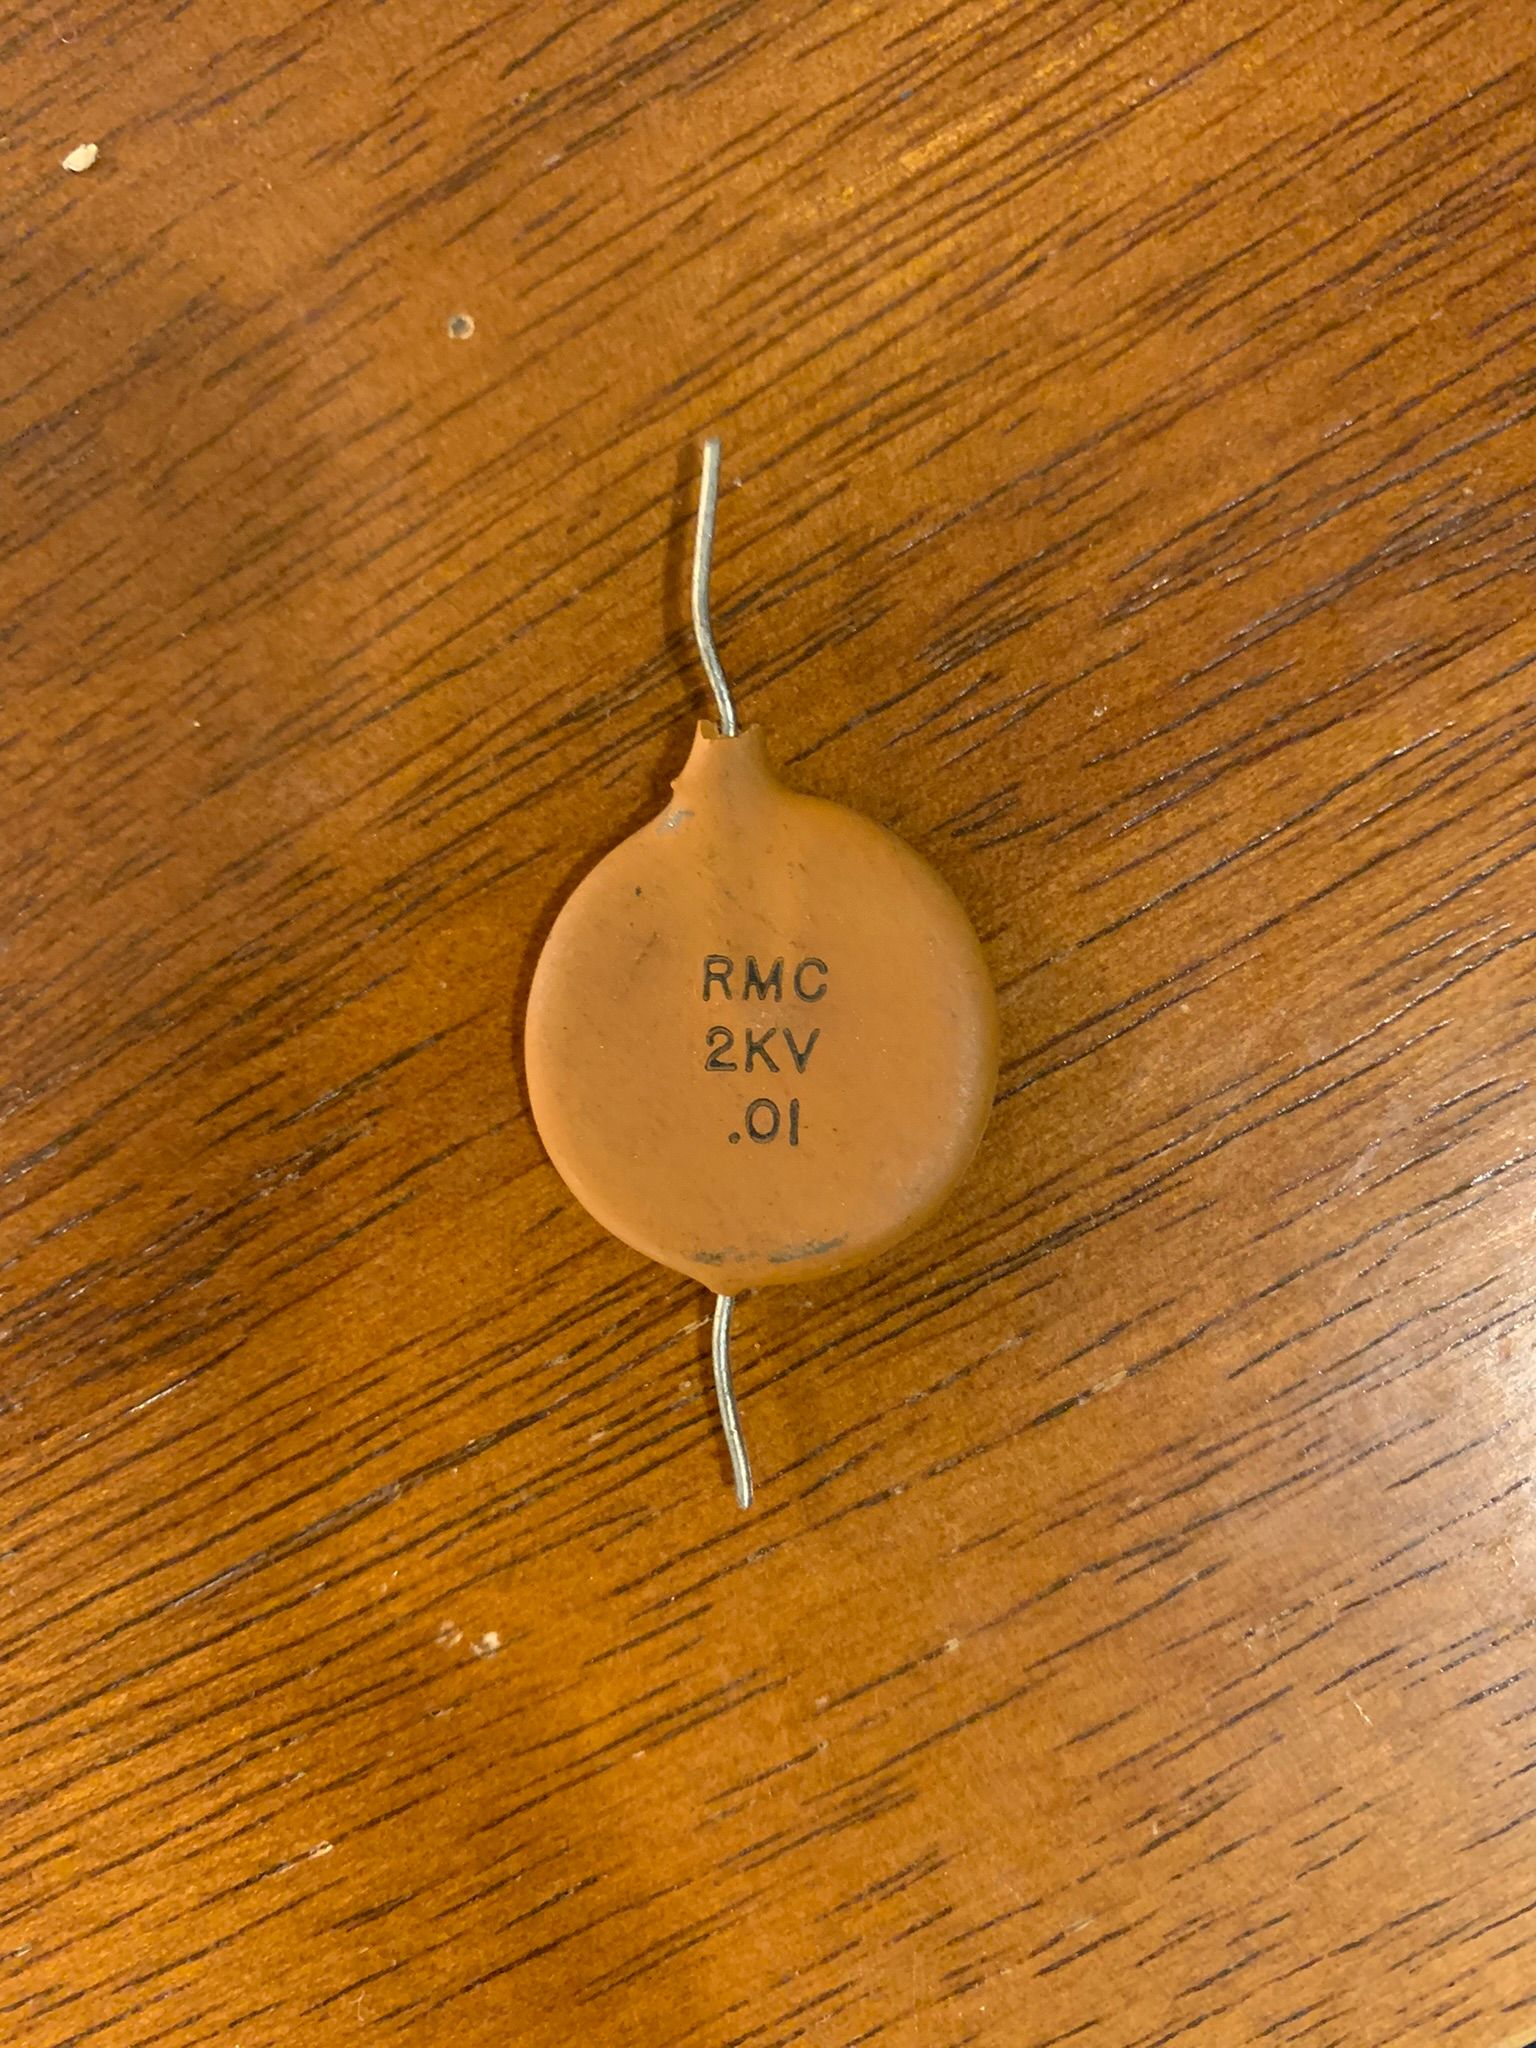
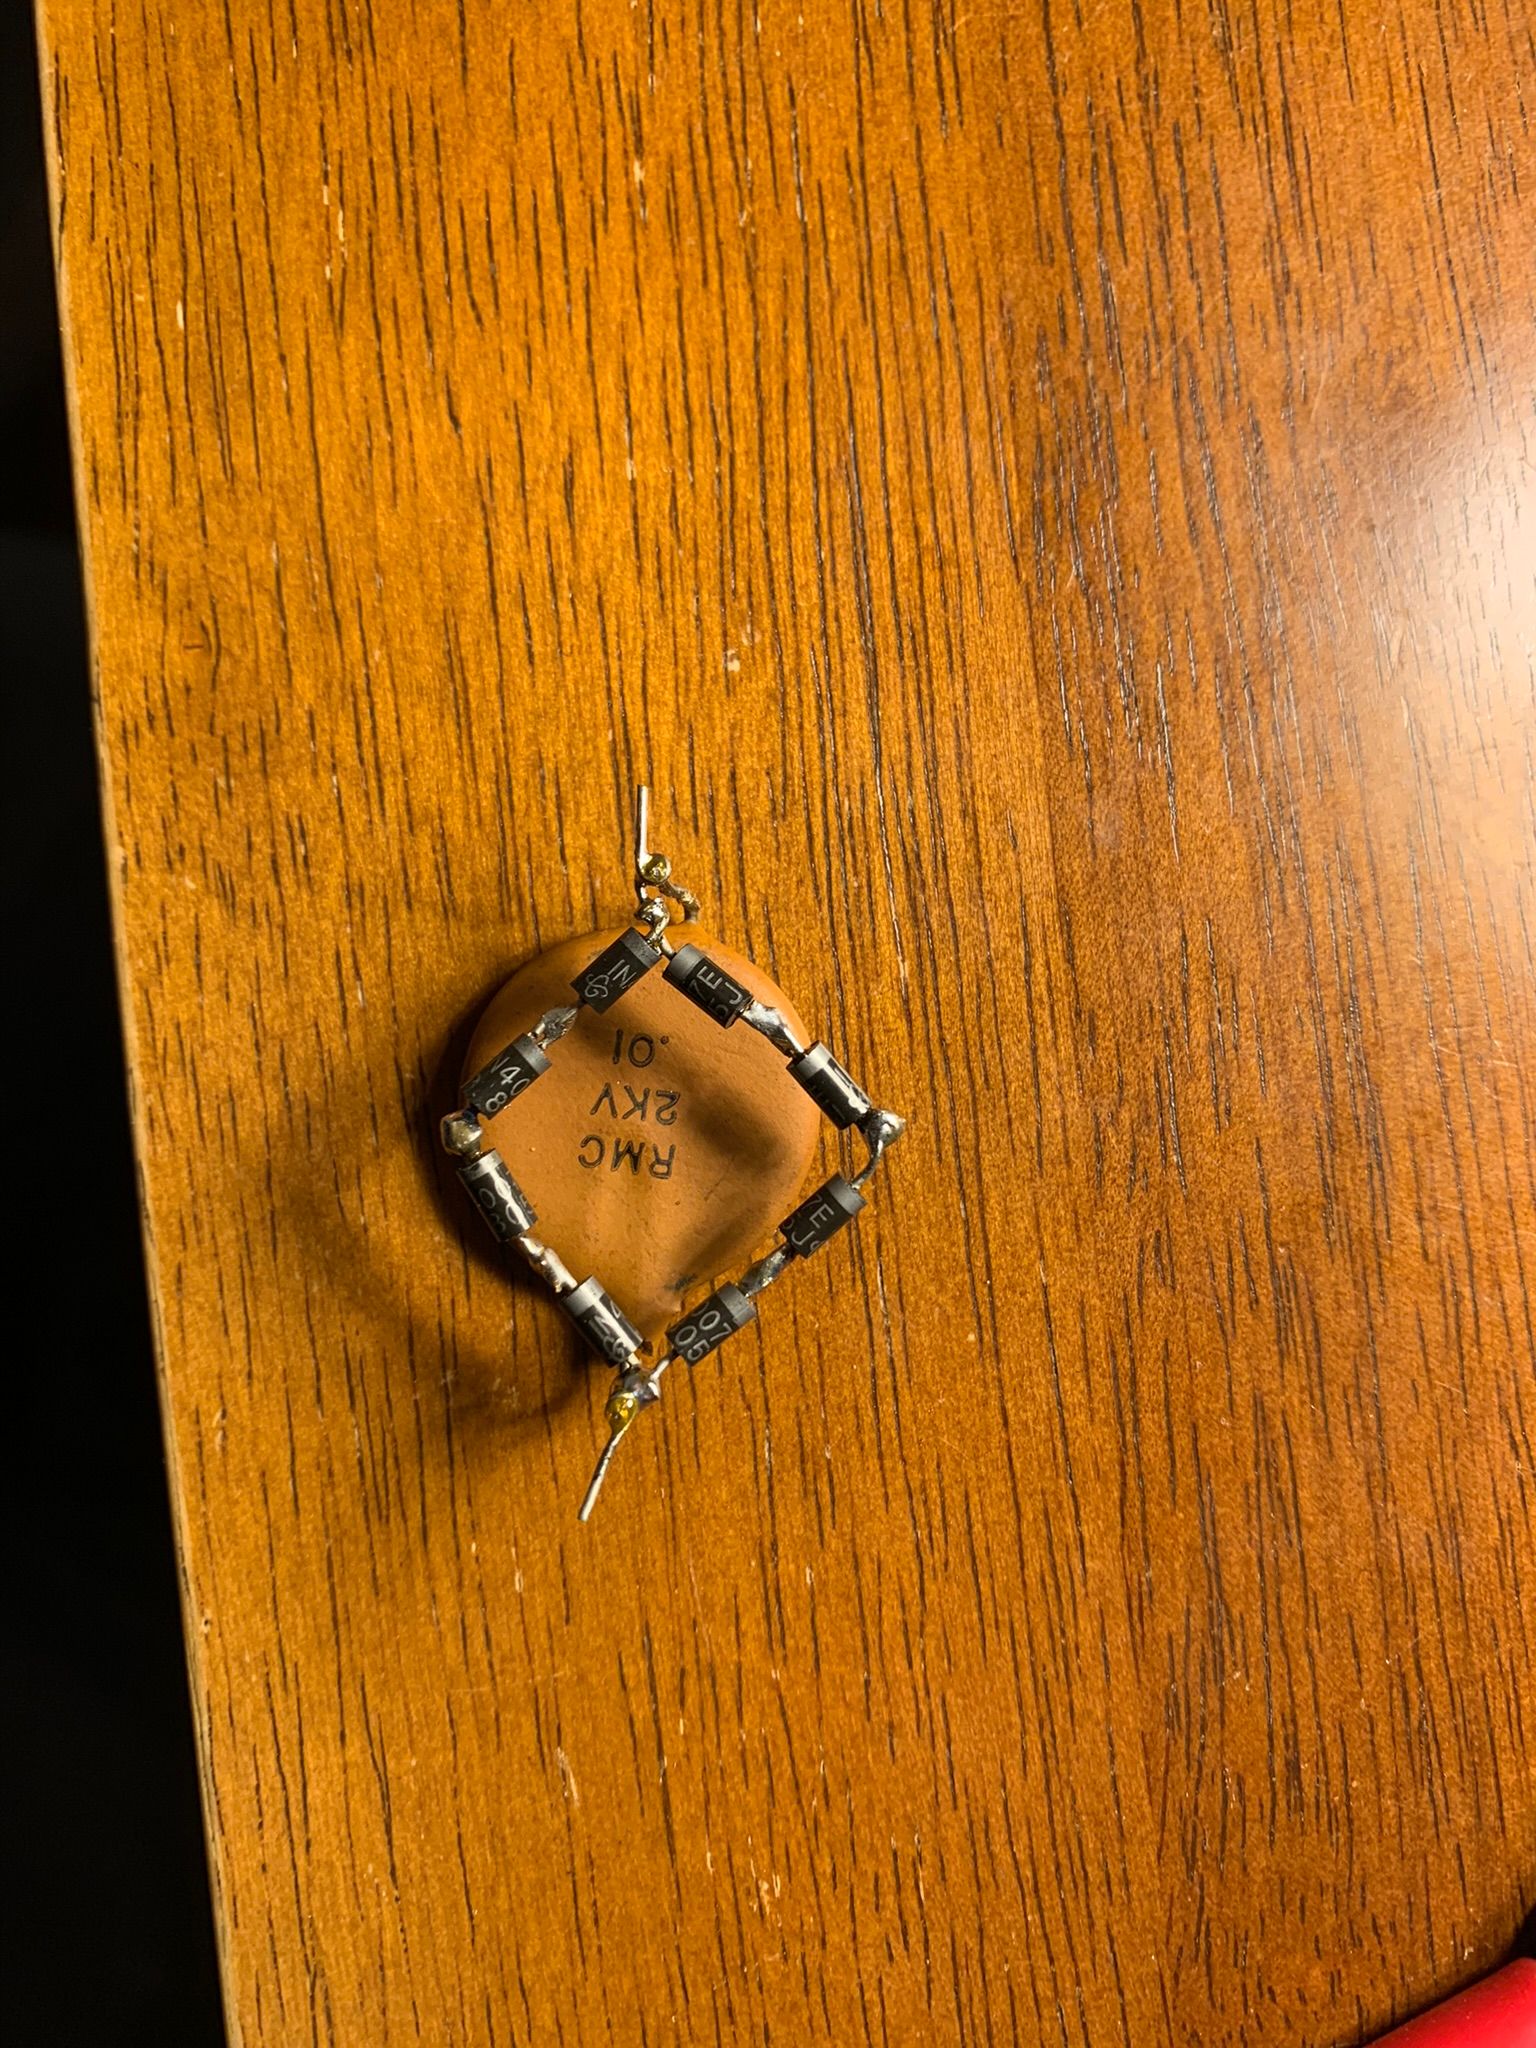
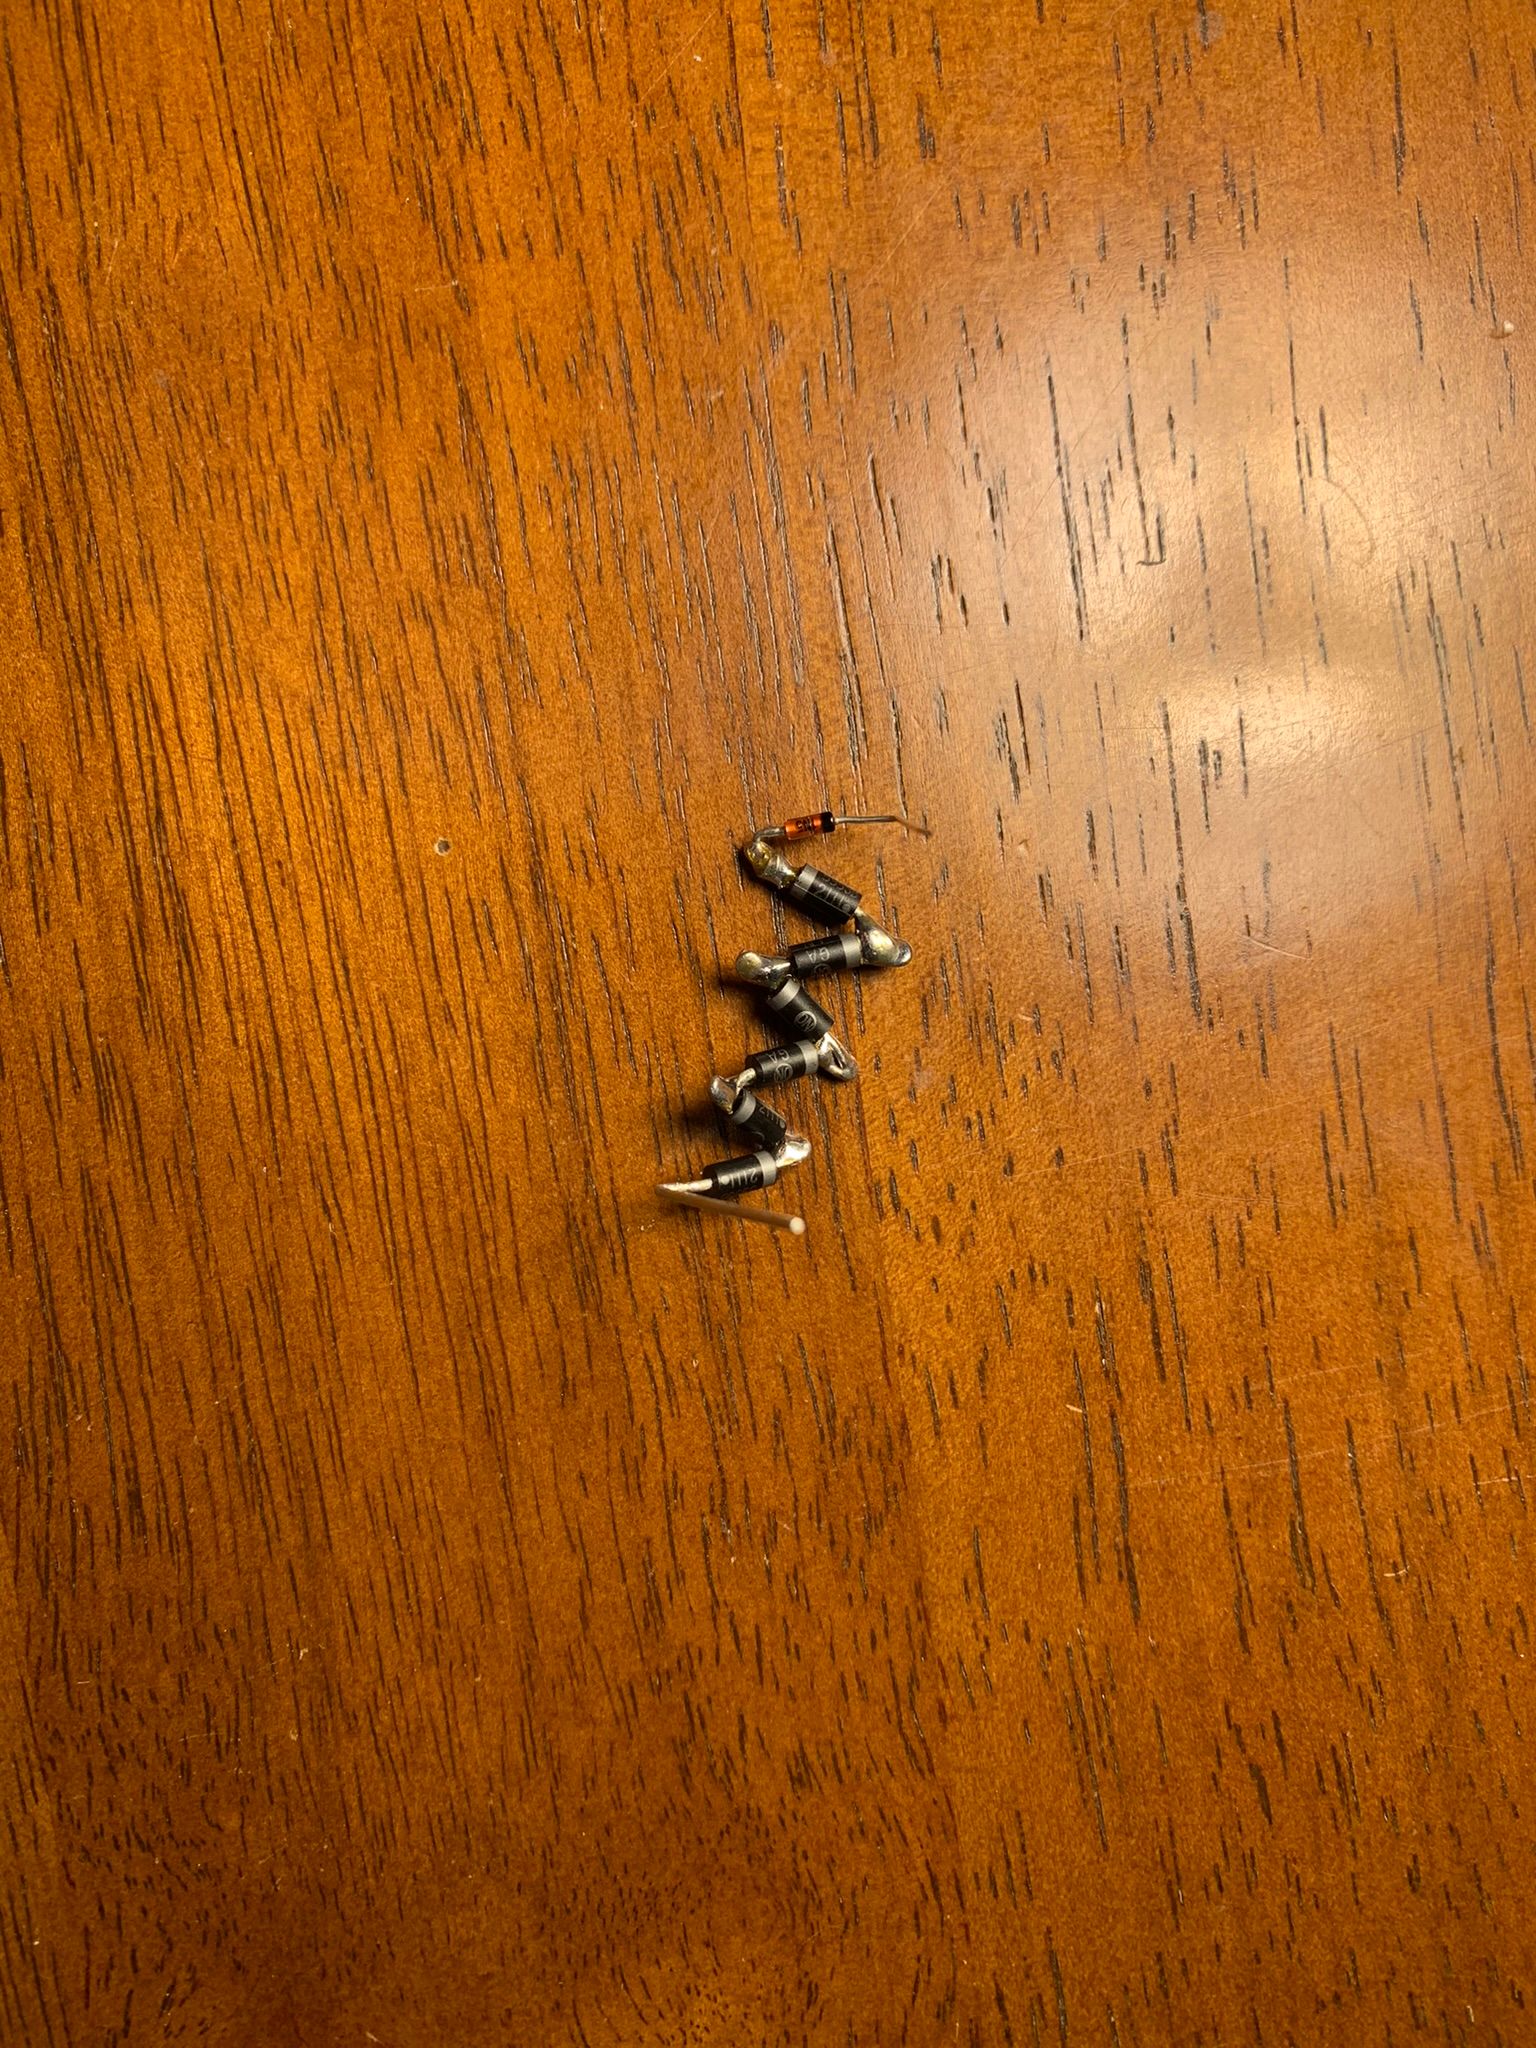
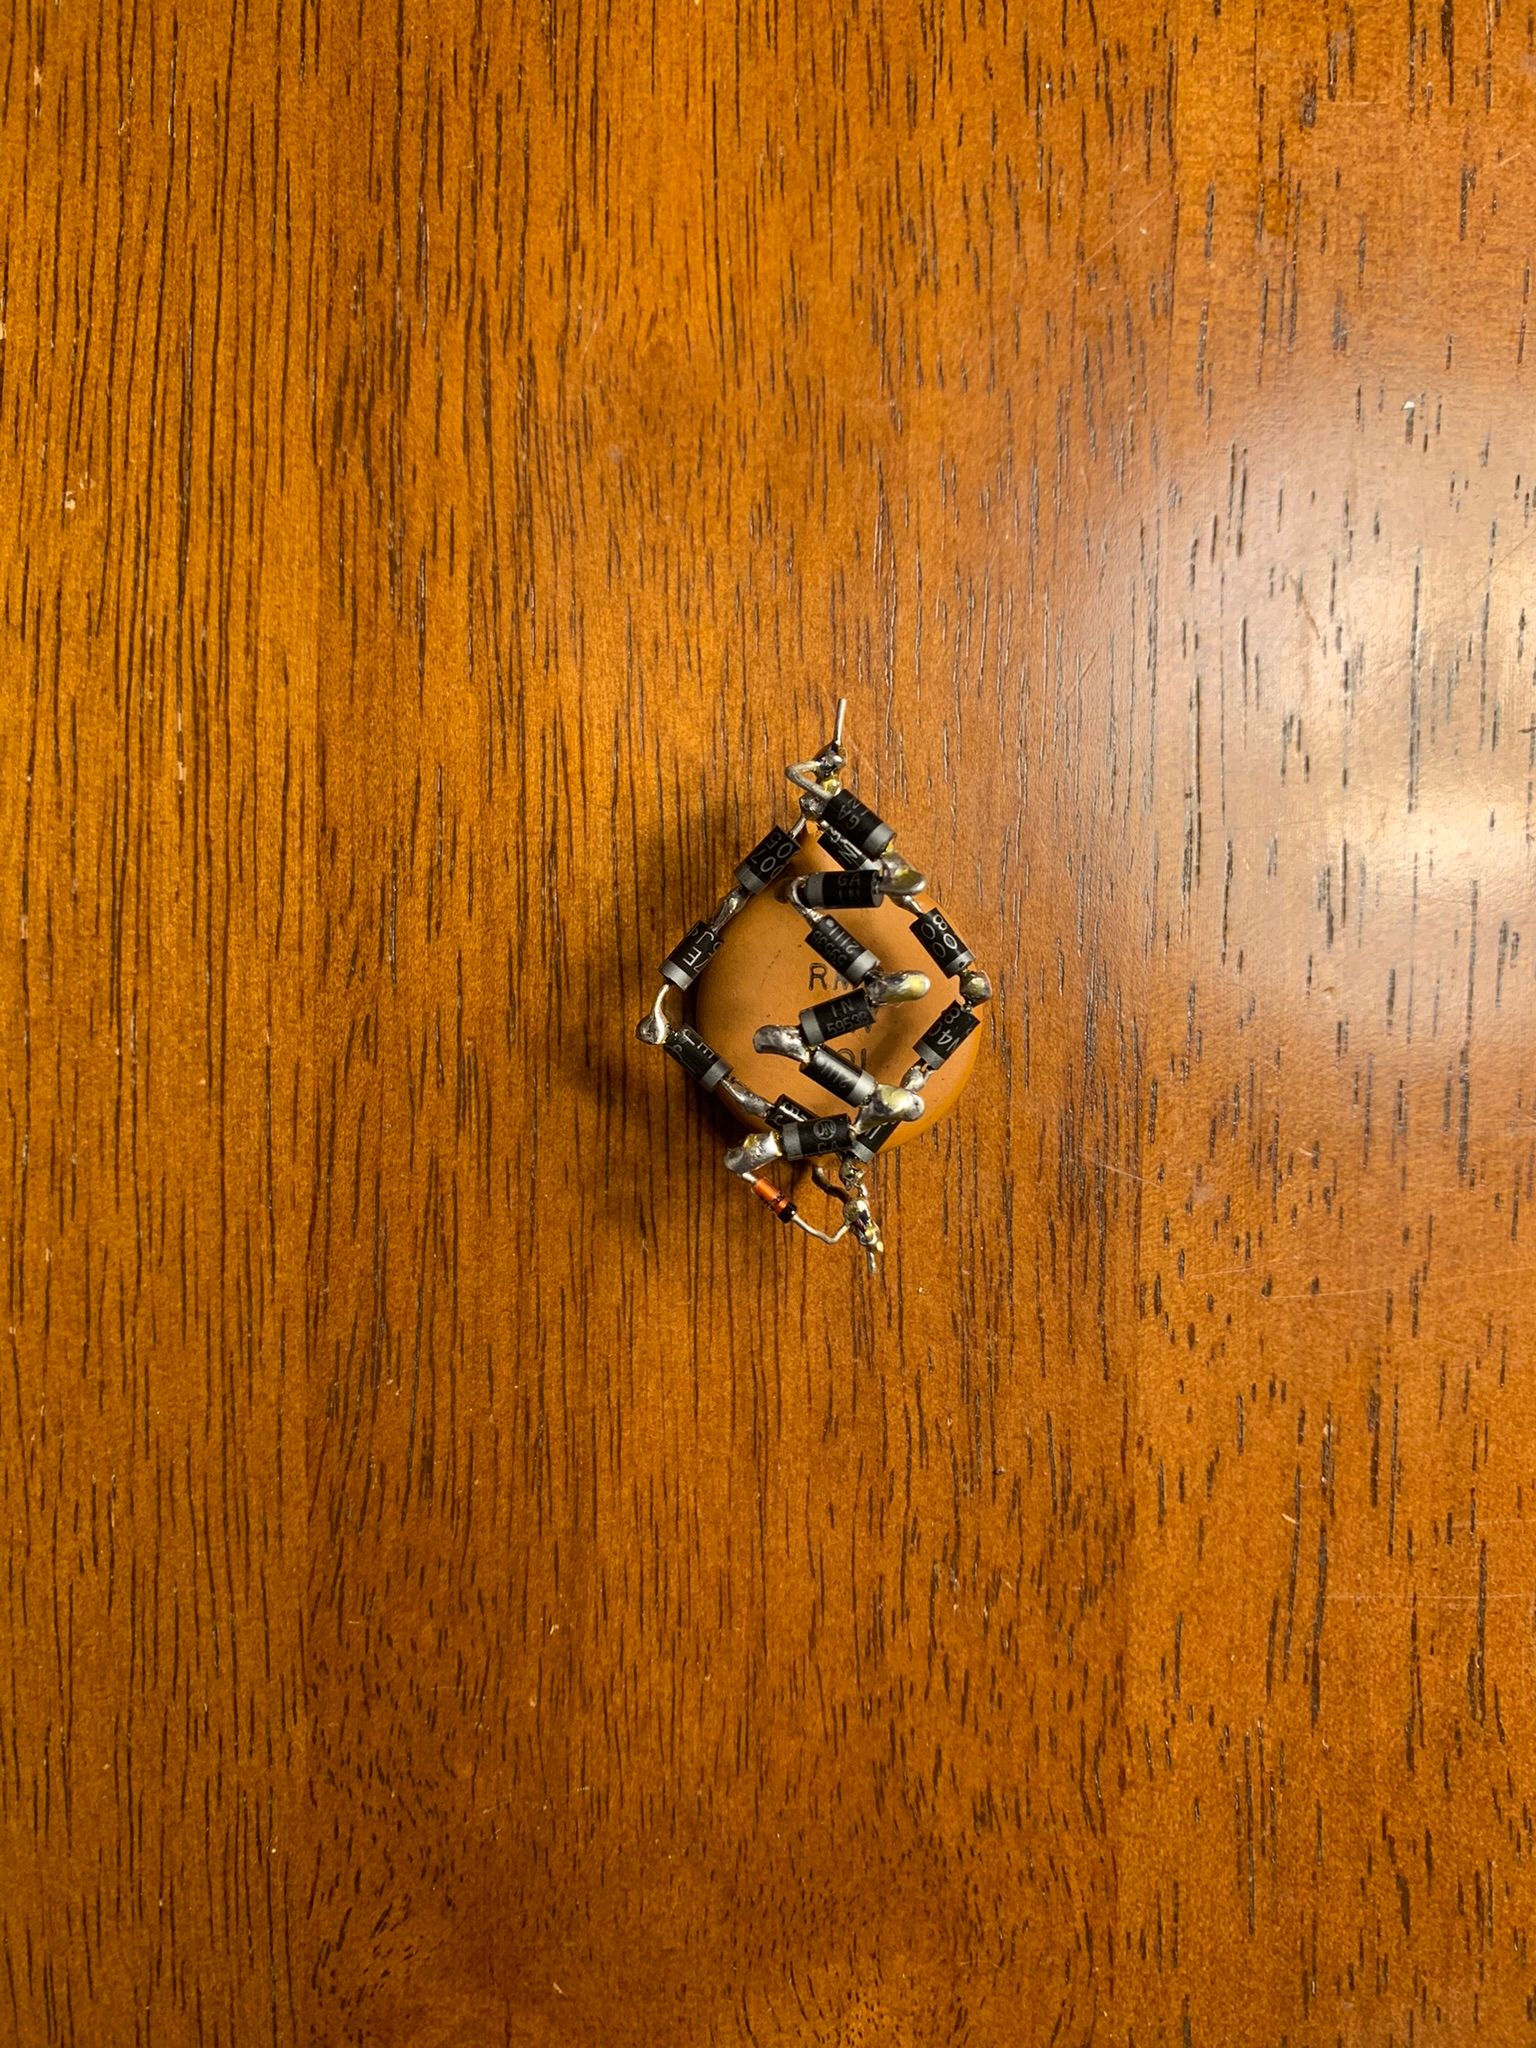
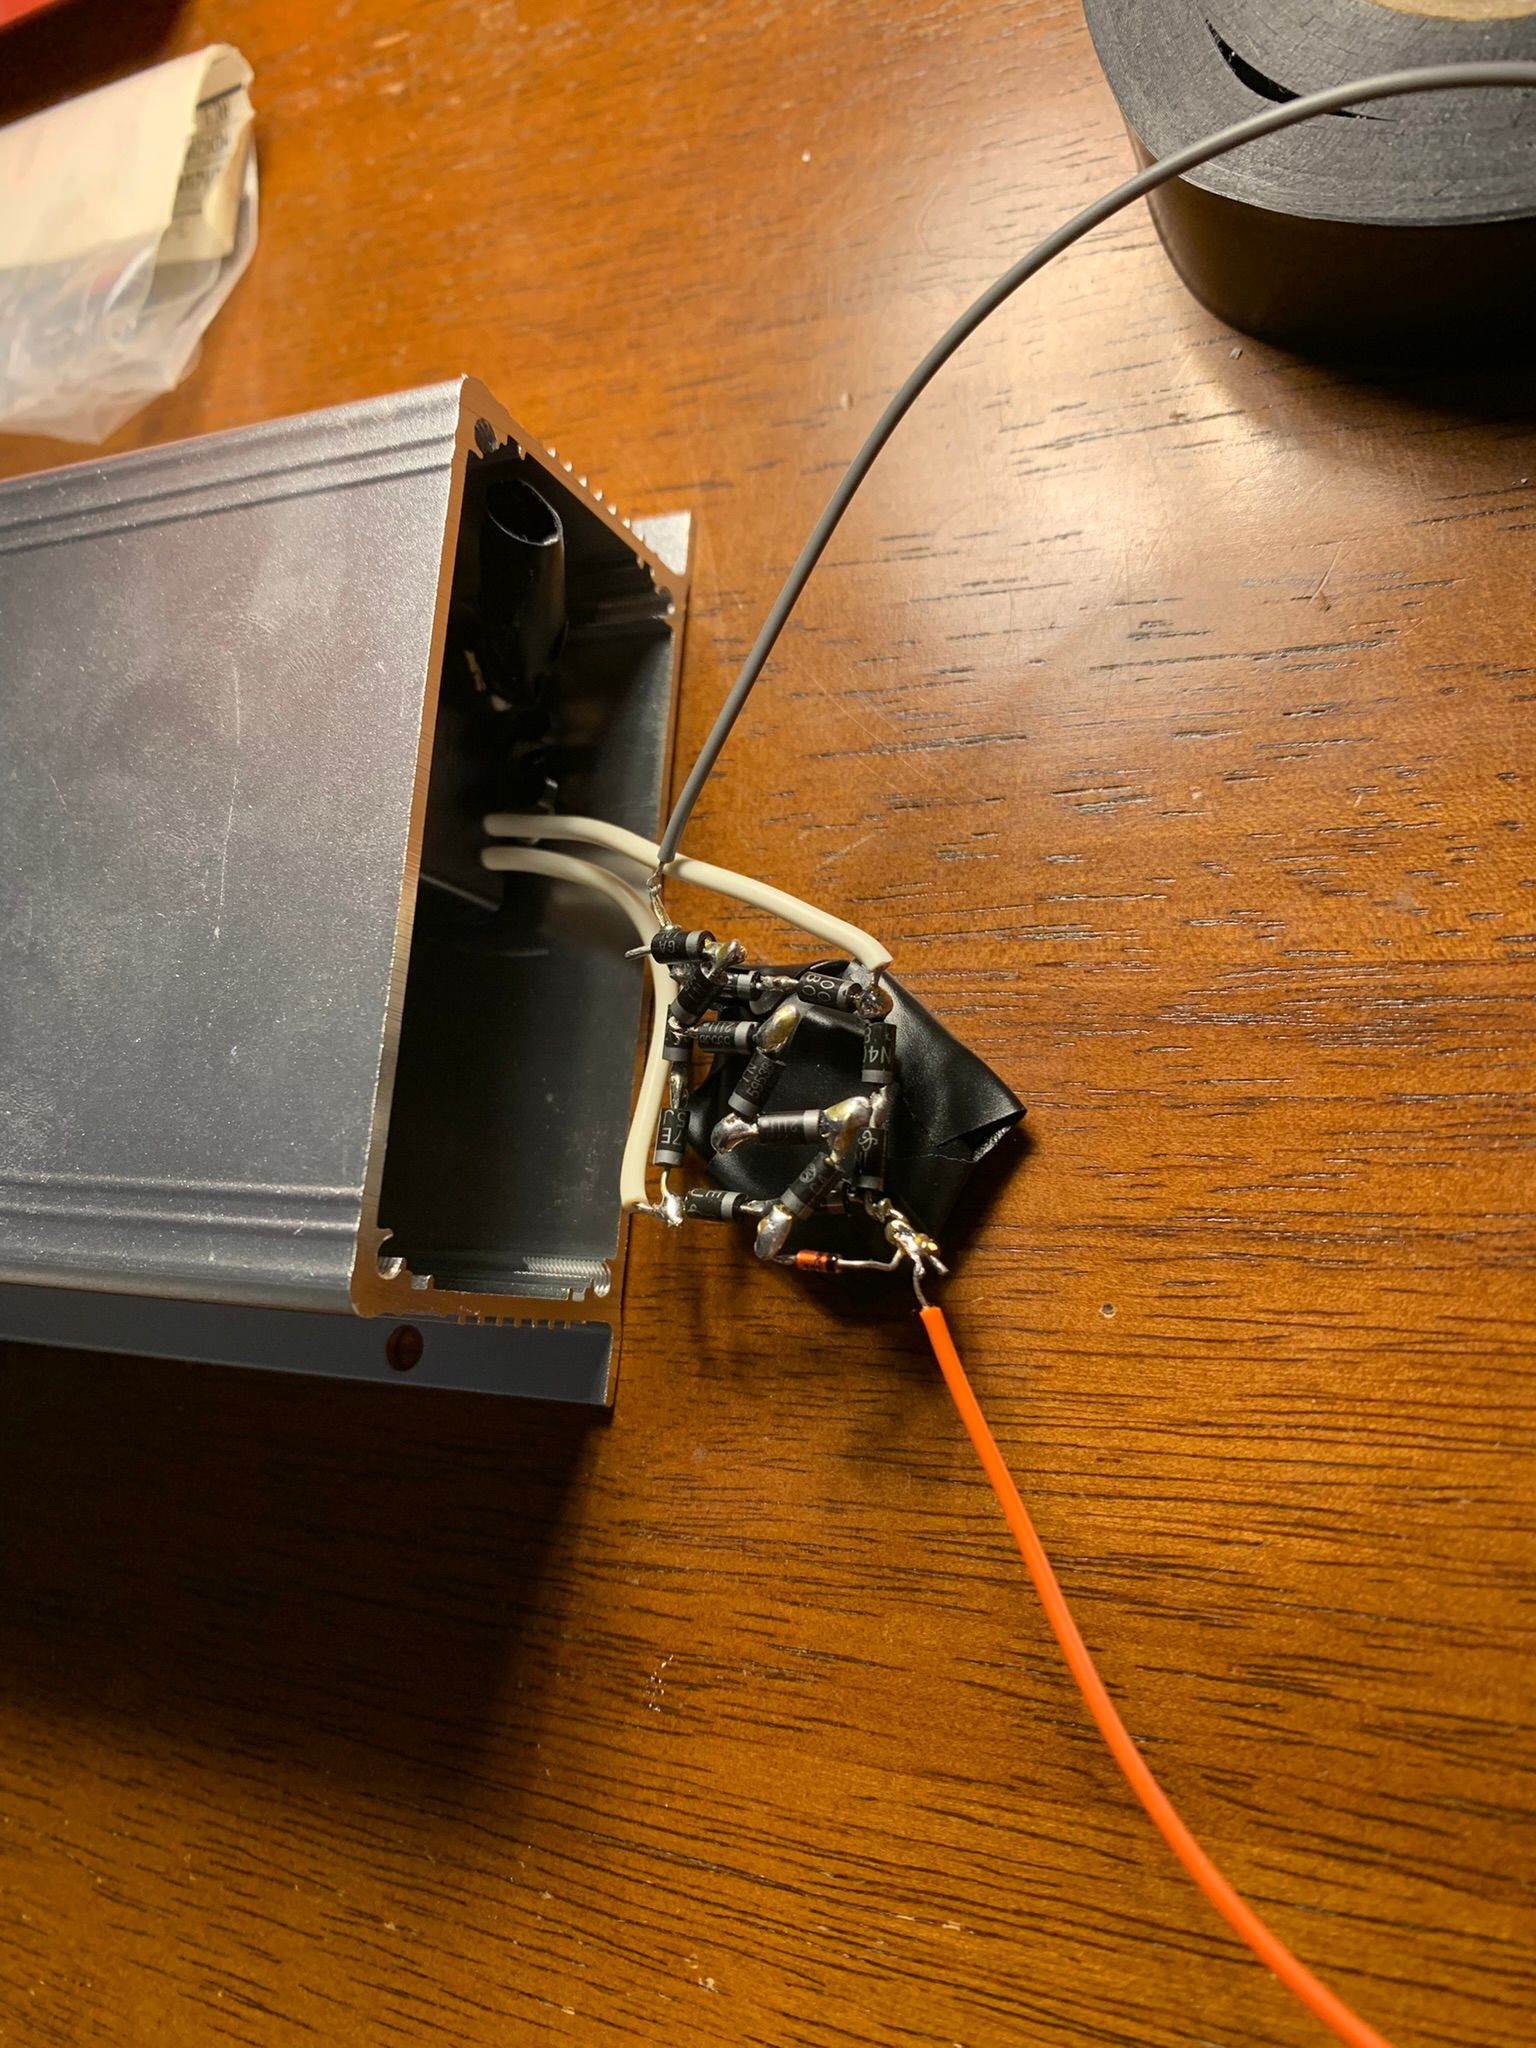
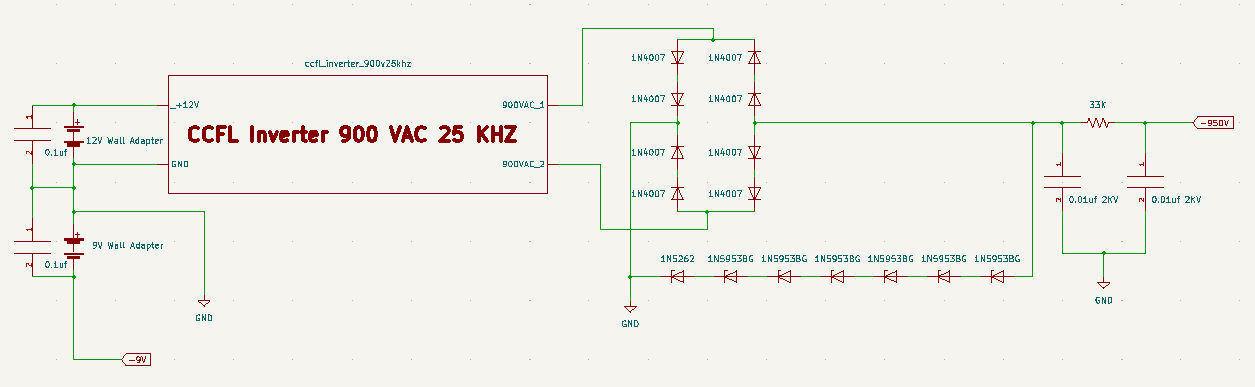
Aside from an aluminum enclosure and a few zener diodes, the high voltage supply was largely a free-form junk-box project. I based it off of a 900 VAC 25 KHz CCFL inverter I had laying around, which required a 12V DC input. I started by throwing a full wave rectifier on the output with a 950V zener stack for regulation, and a high voltage capacitor for filtering.
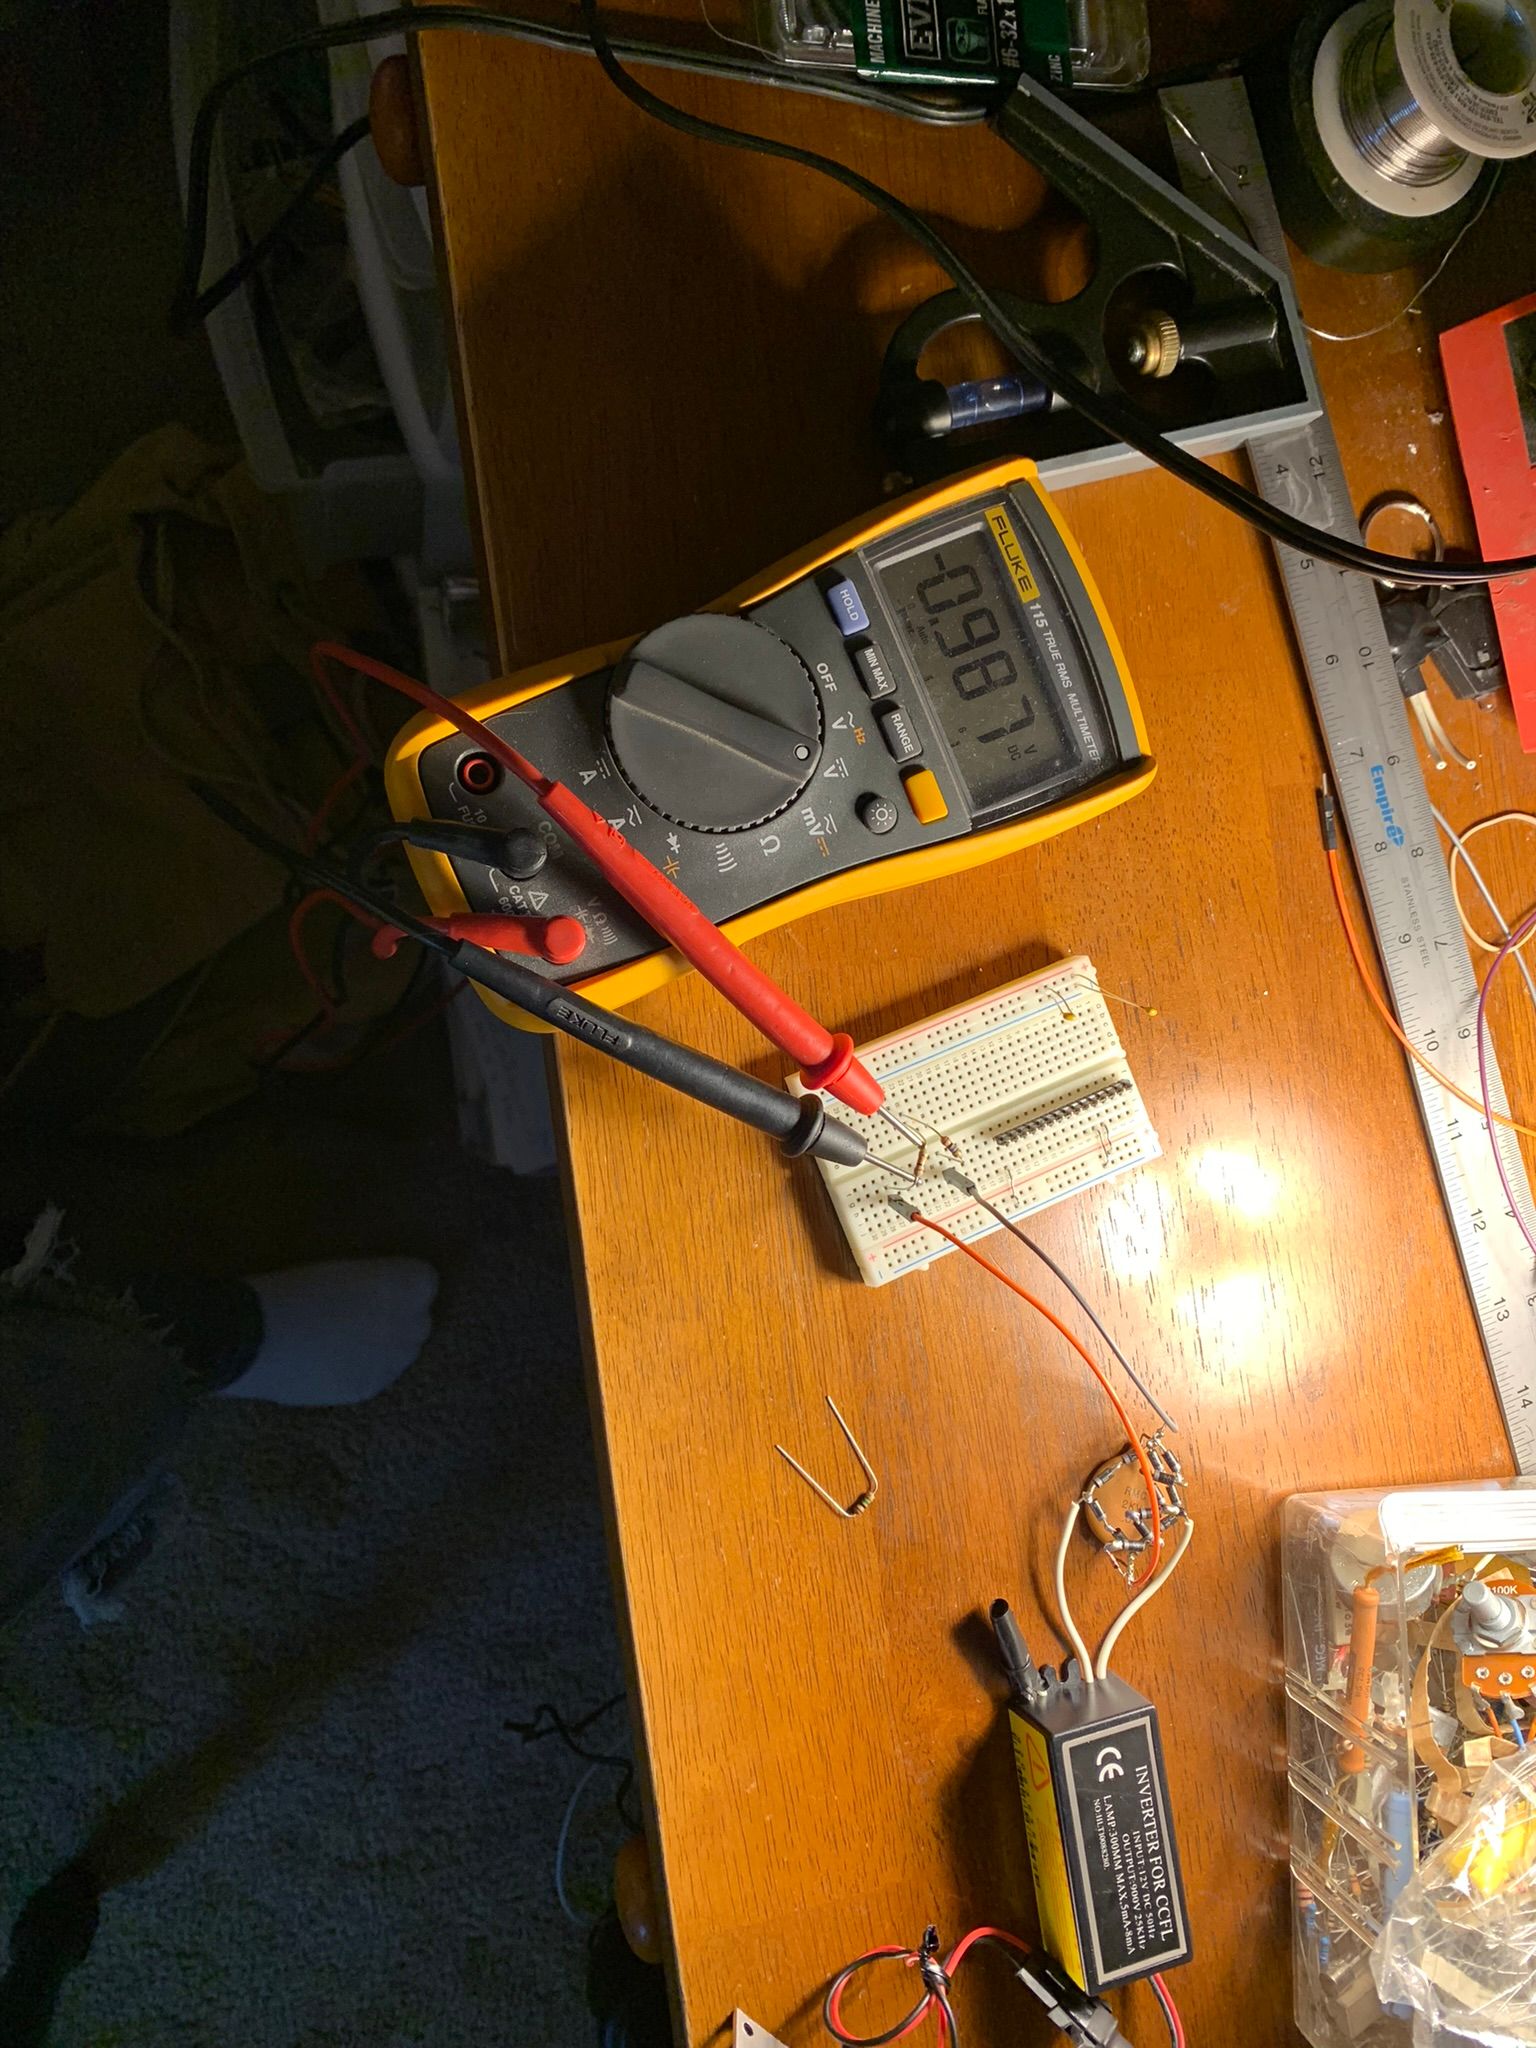
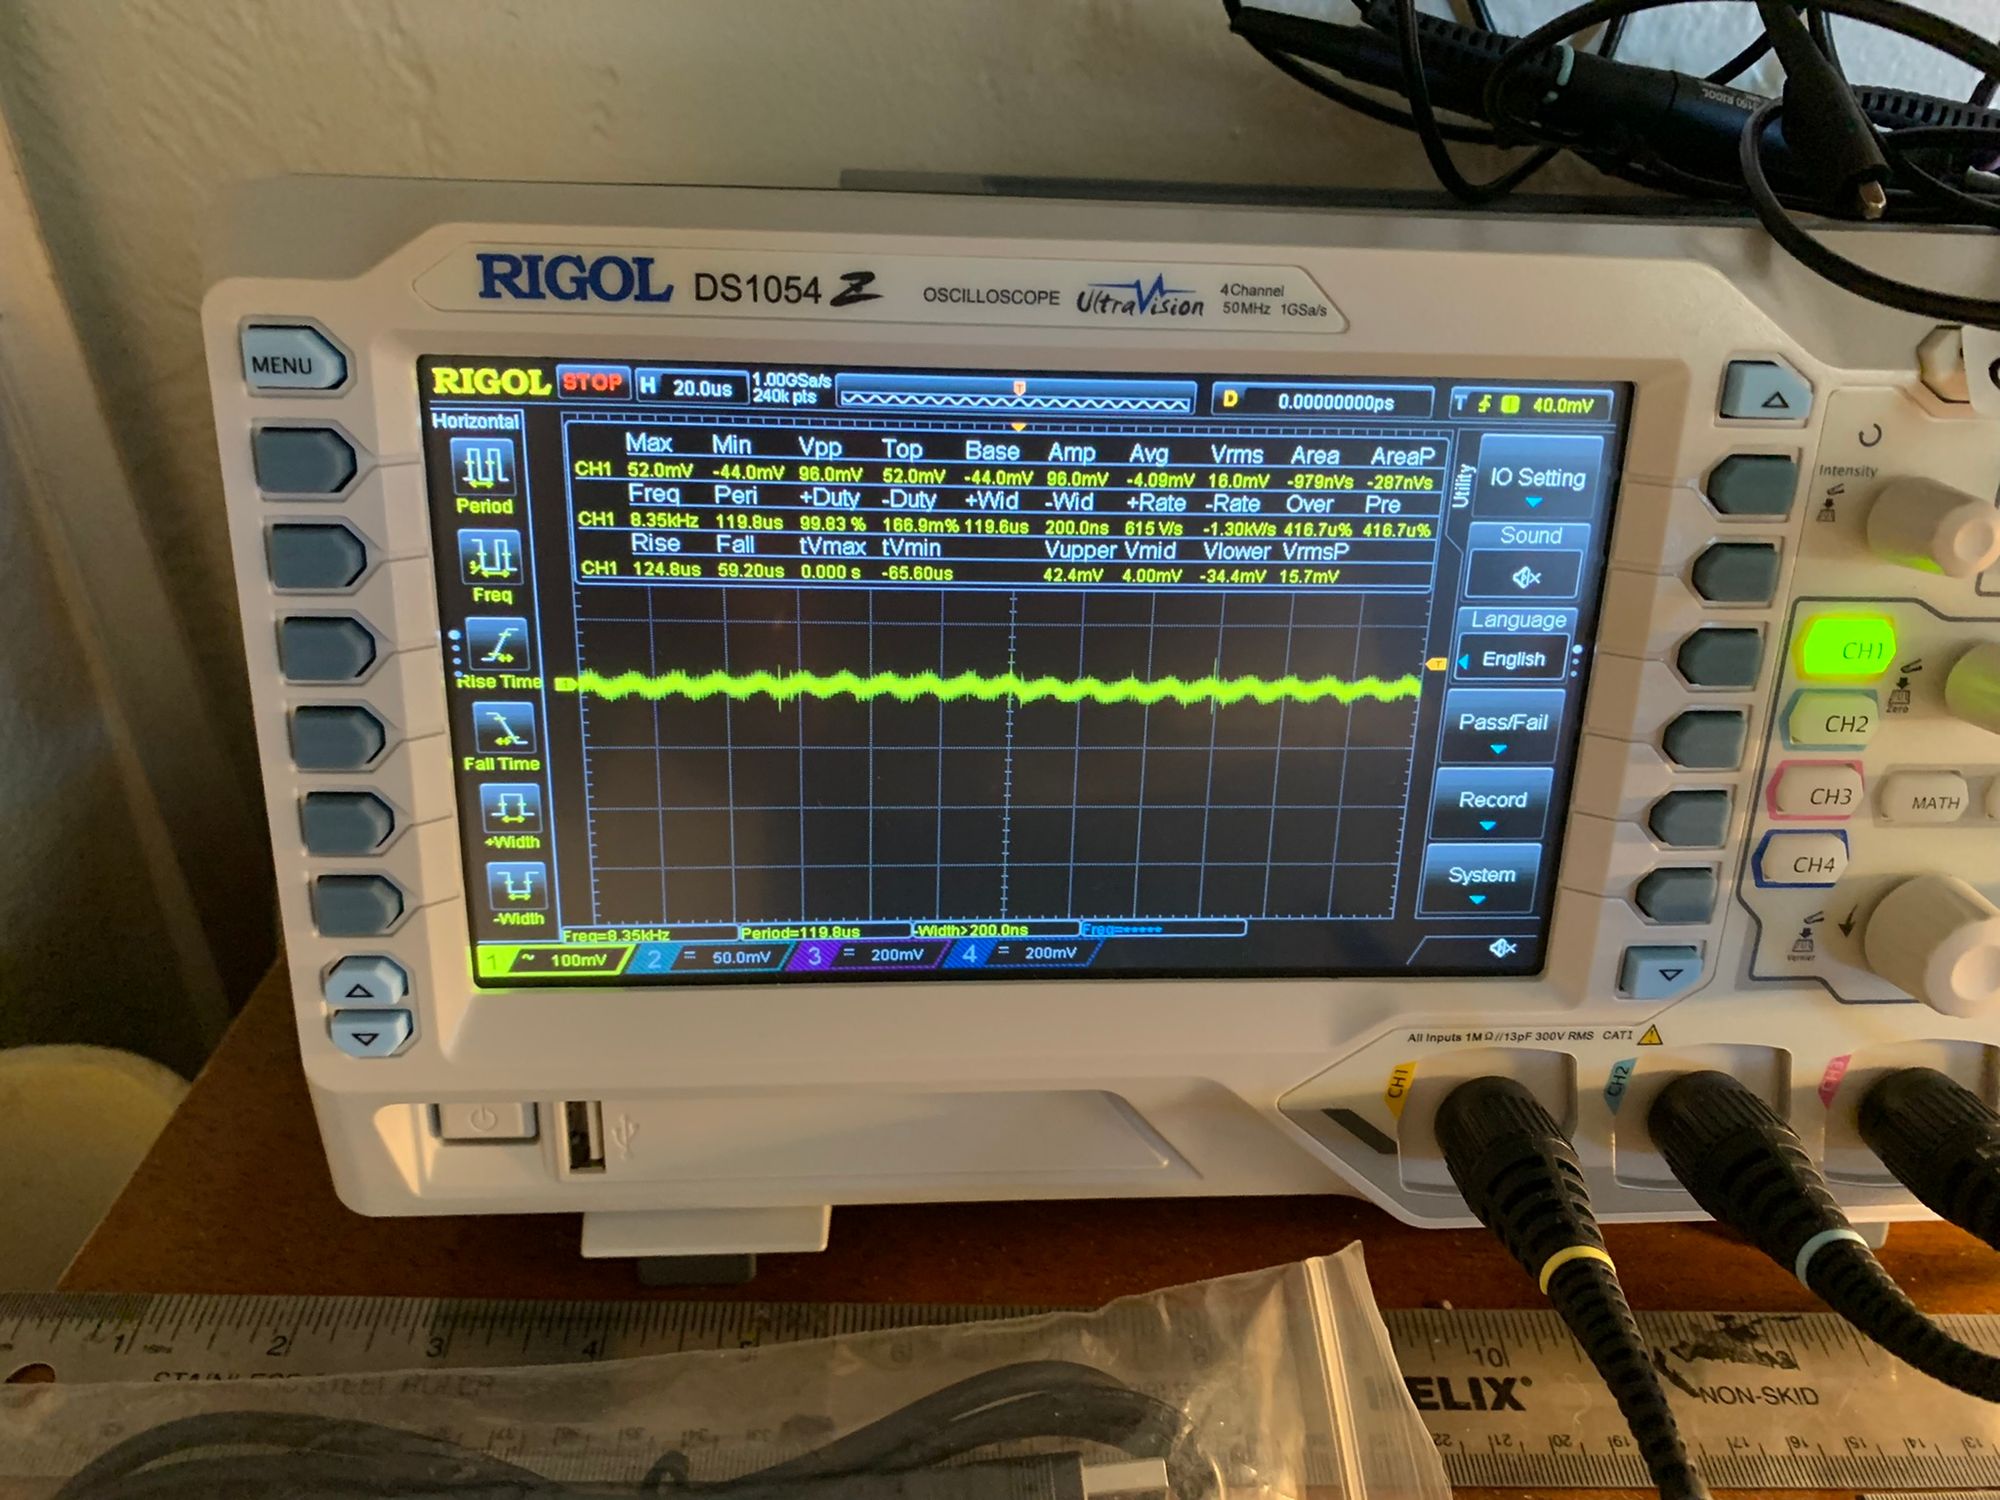
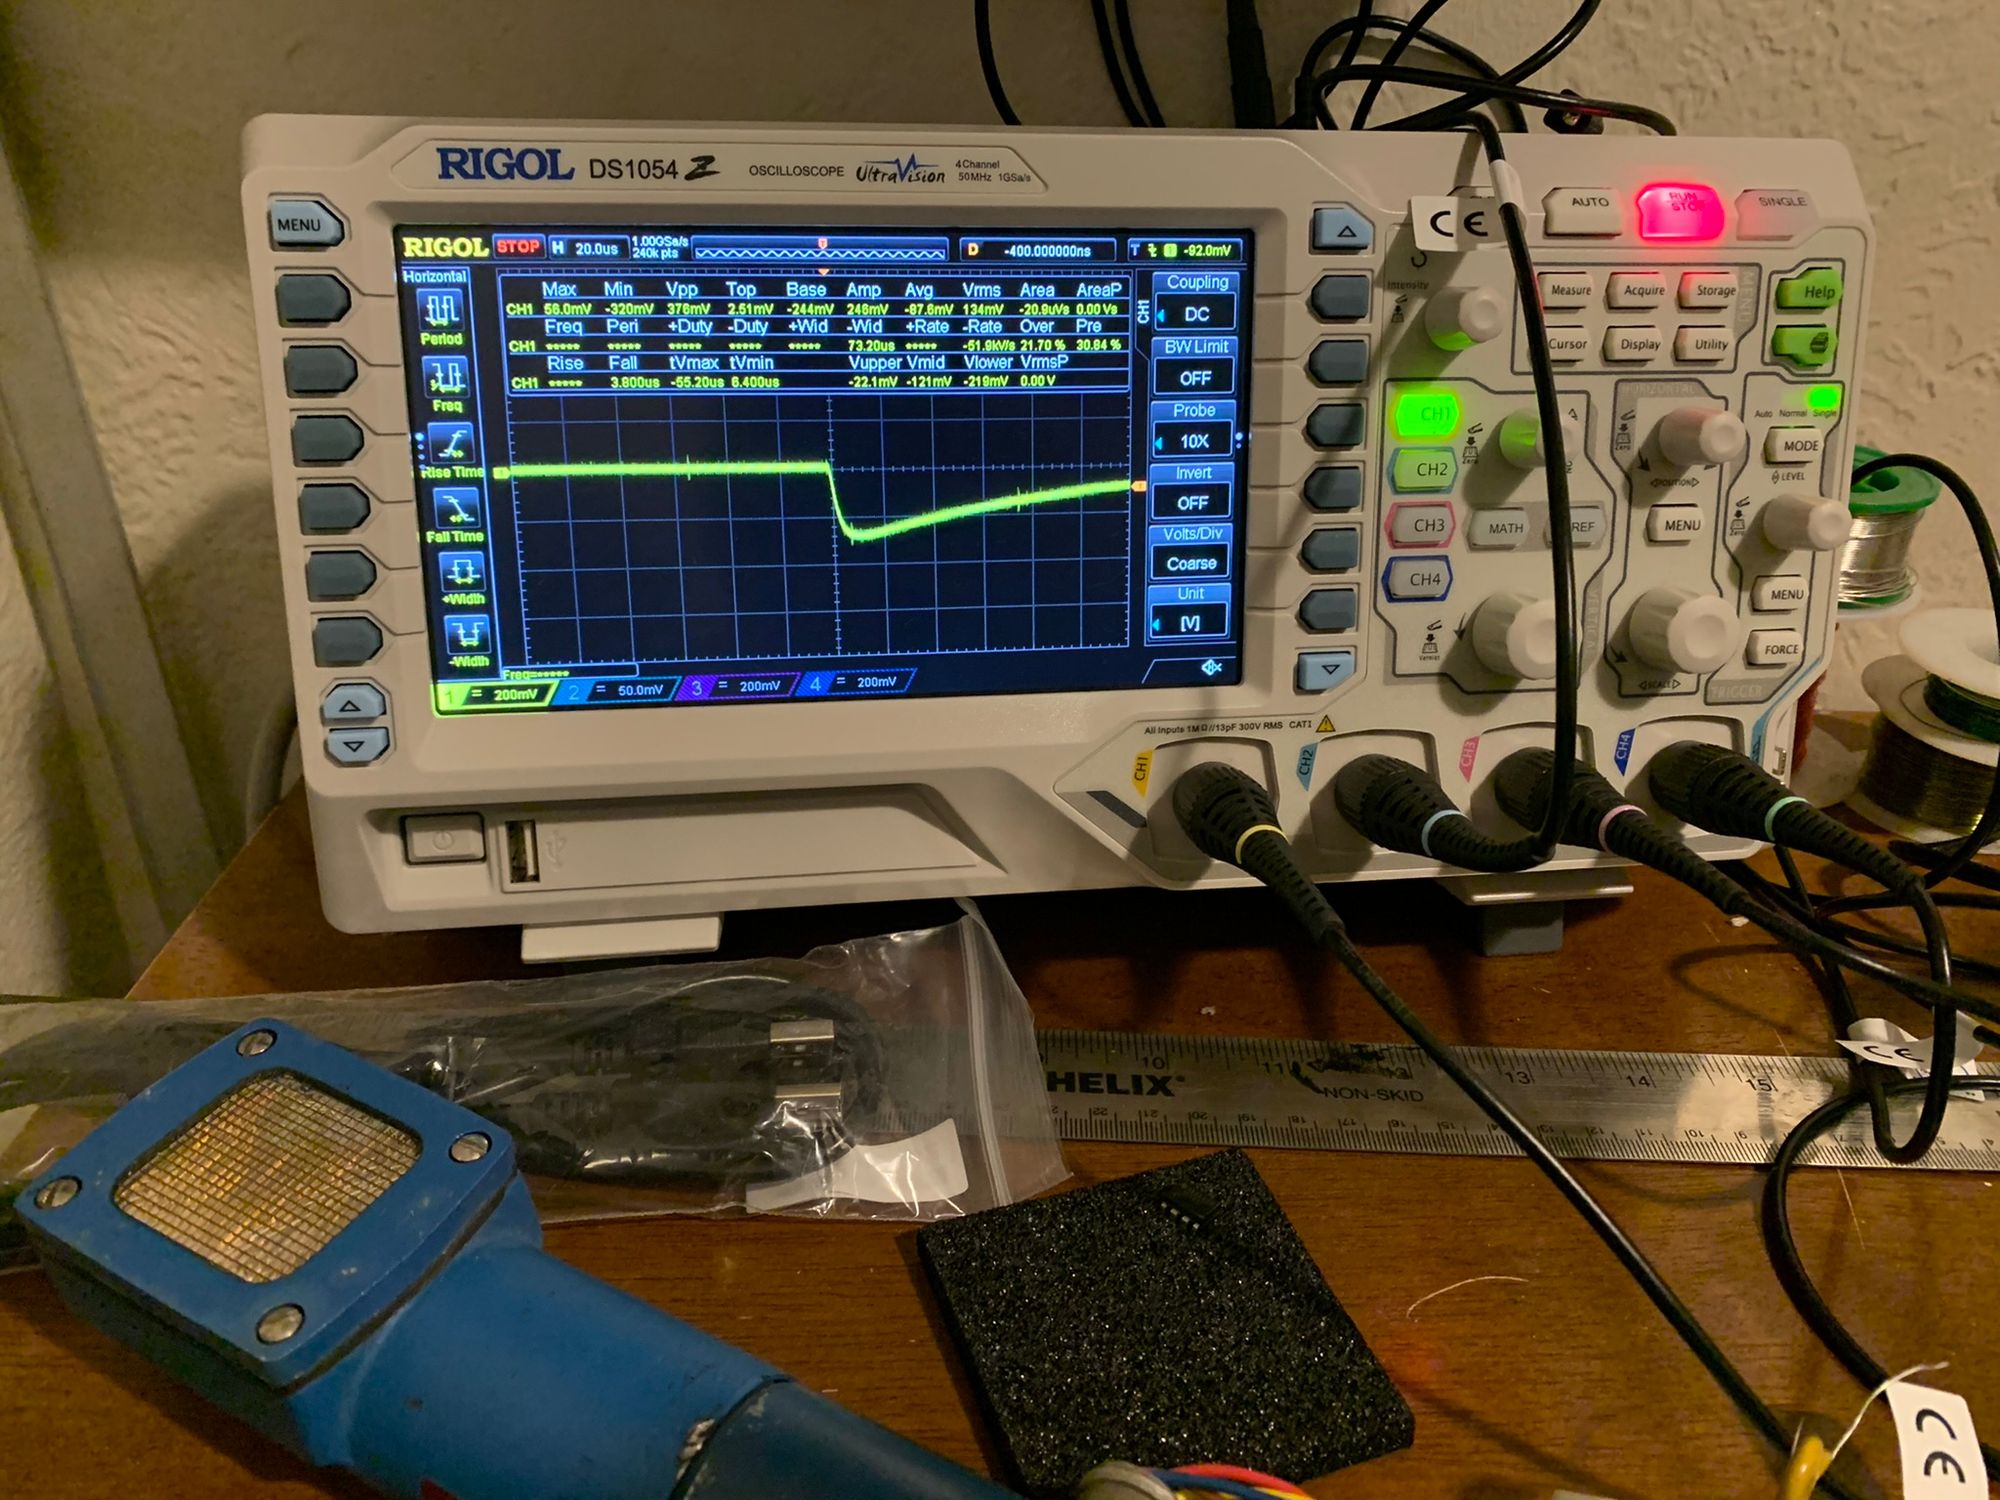
Once I was confident the DC output voltage was close enough to the spec'ed -950V to work, I measured the output ripple to determine if it might interfere with the output pulses.
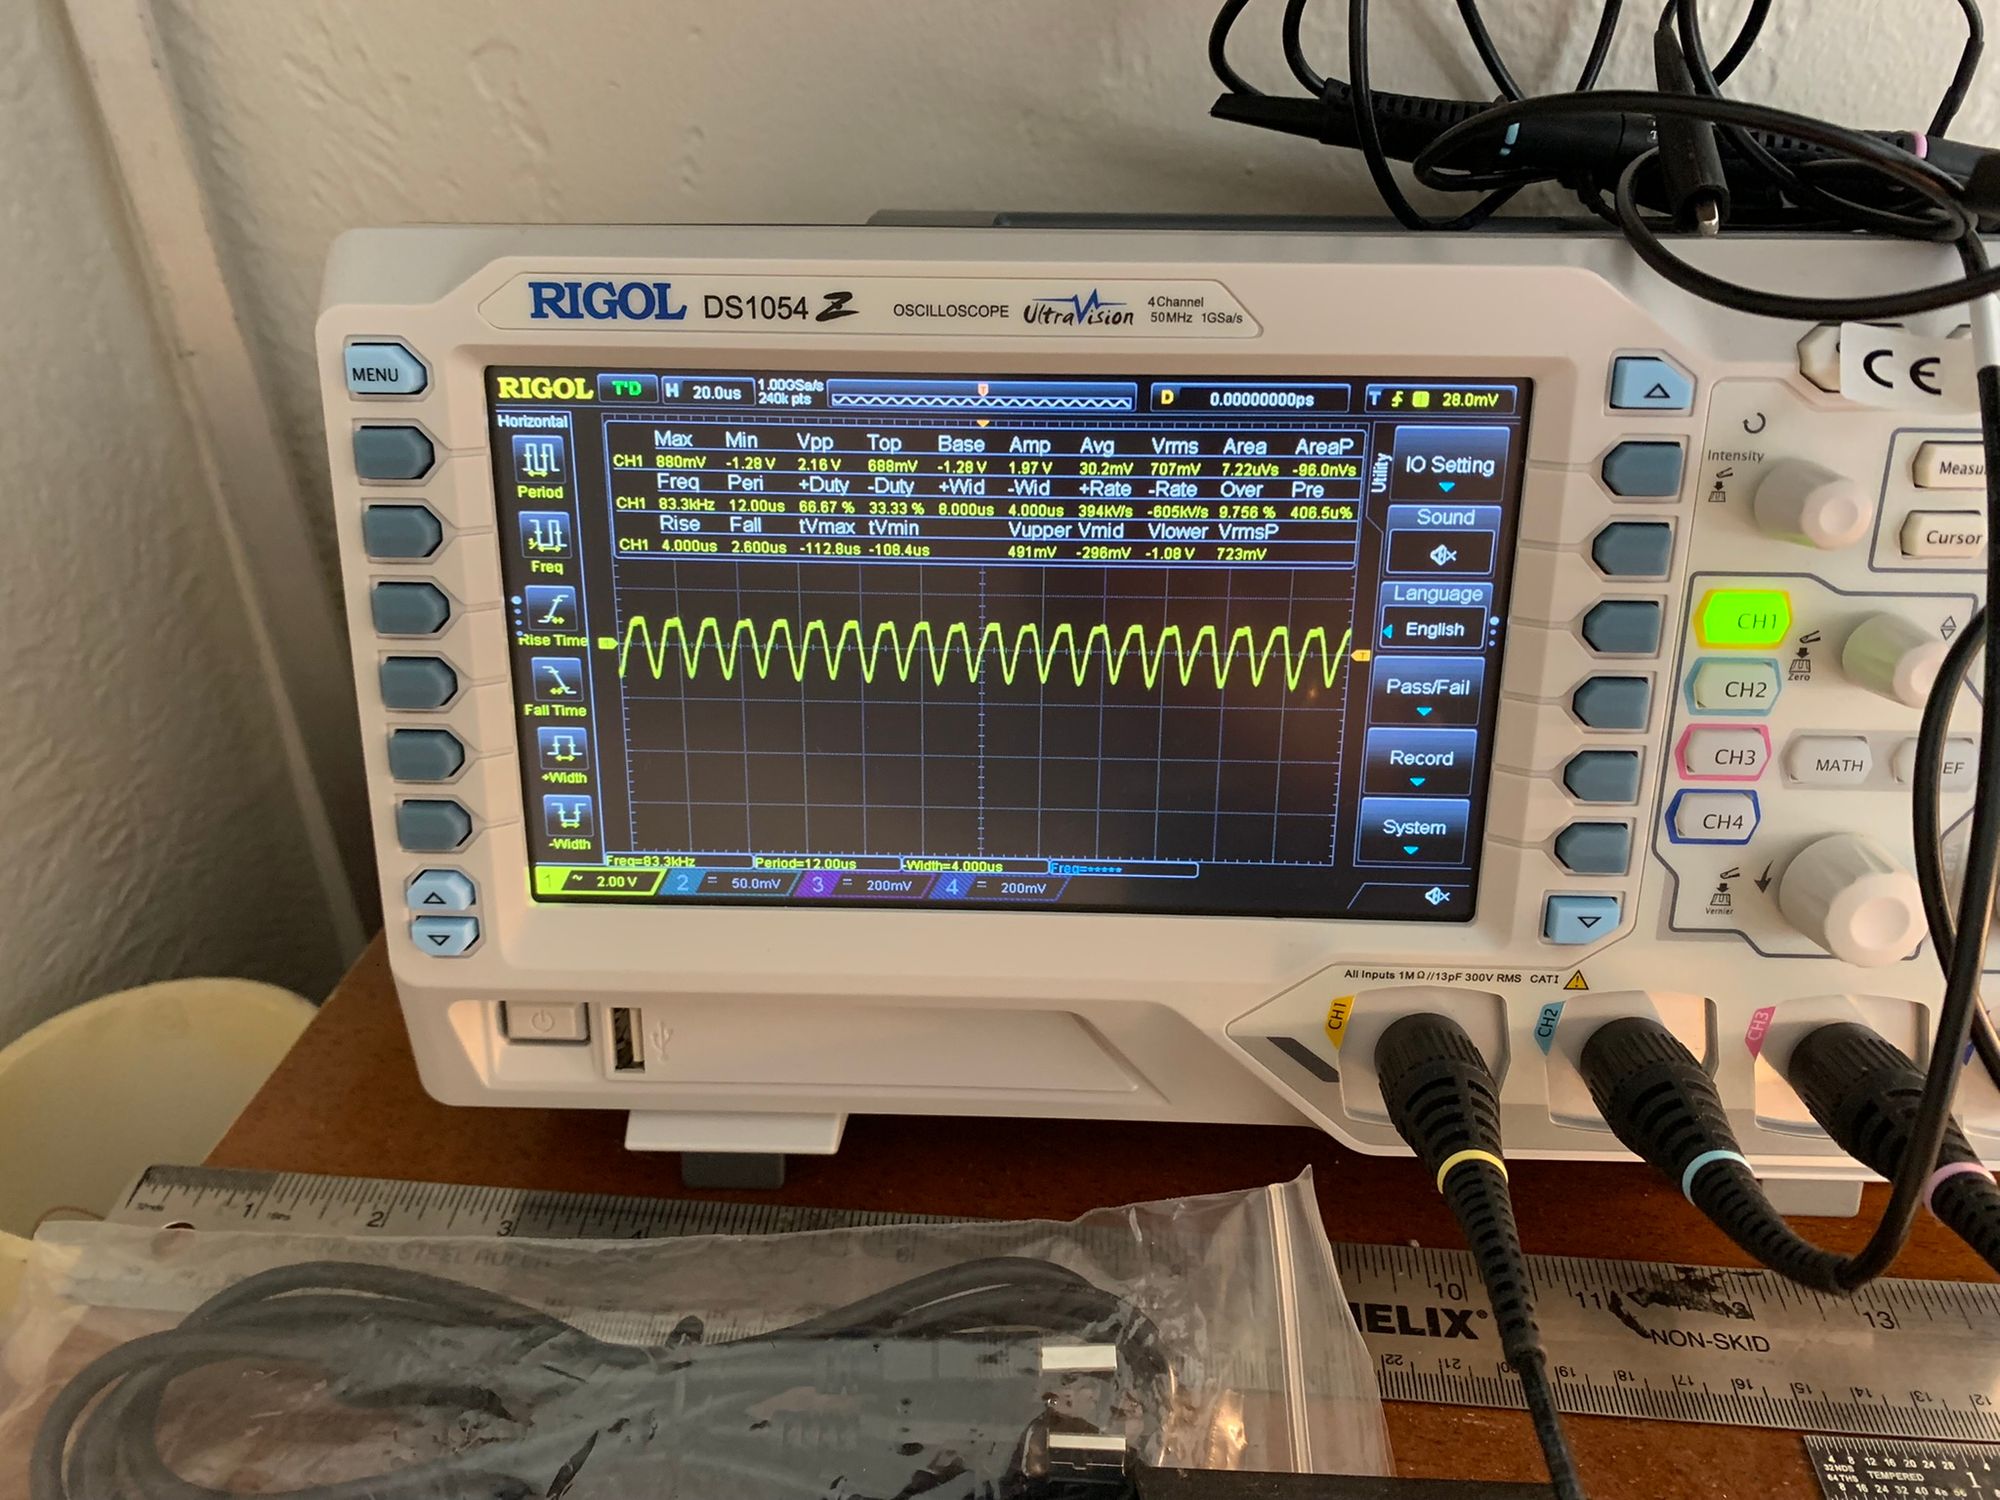
It was clear that ripple was going to be an issue, so I added an extra passive low-pass filter to the output of the power supply and measured ripple again.
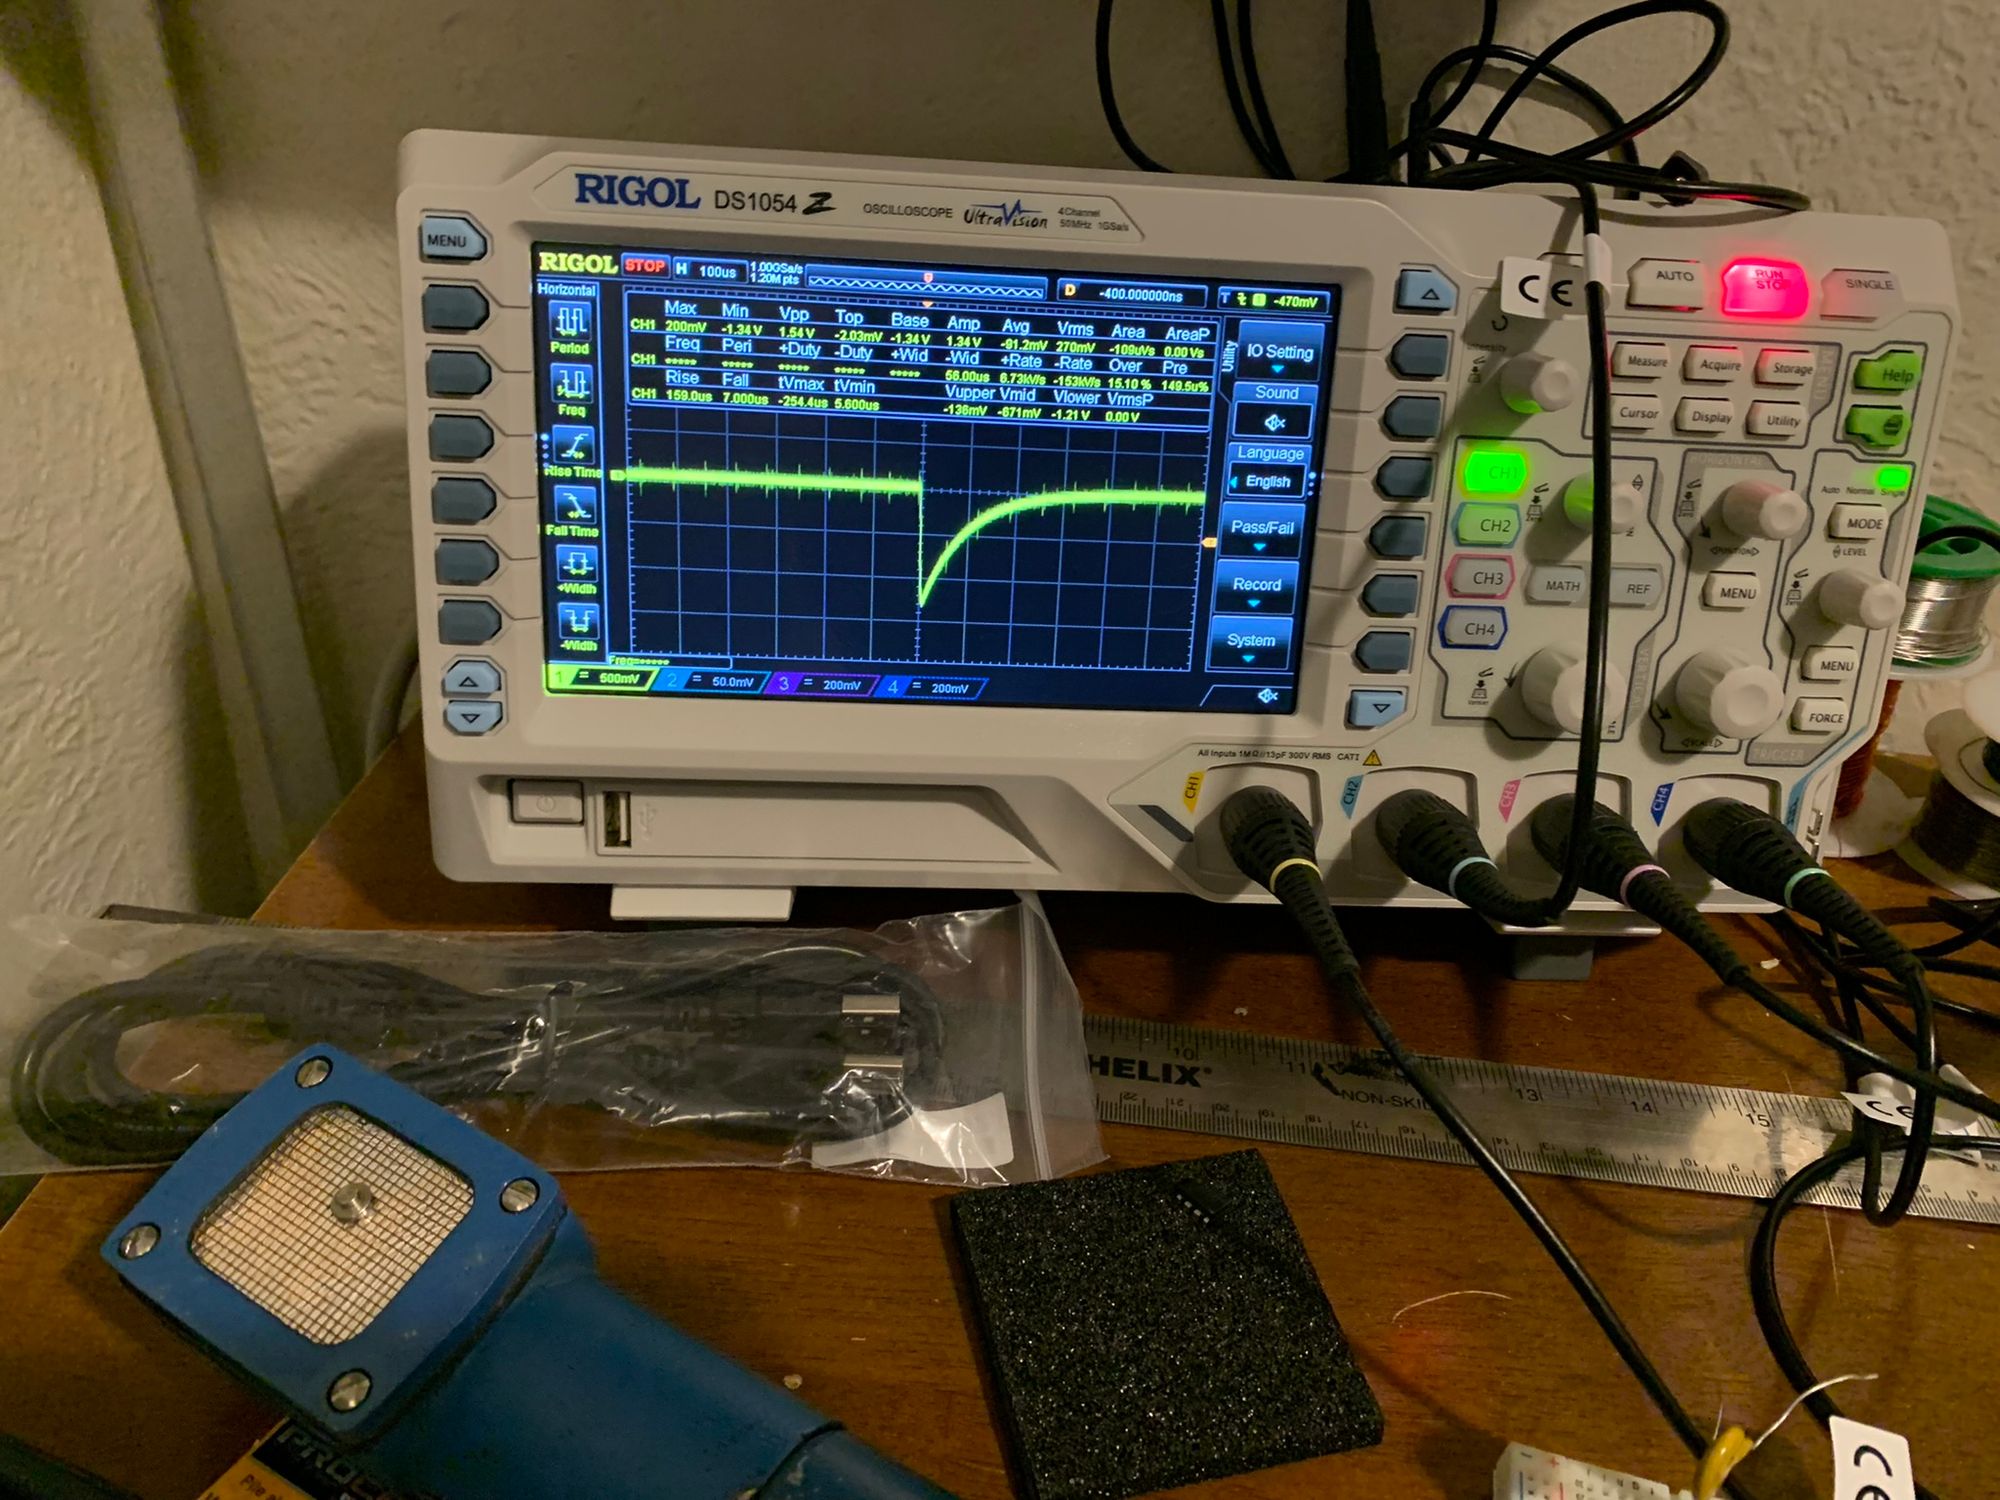
A single-order passive low-pass filter improved ripple significantly though it still wasn't great. In retrospect, I probably should have done those measurements under load, though PMT dividers tend to be very high impedance anyway. I decided this was good enough for a quick test to compare the ripple to the actual scintillator output pulses.
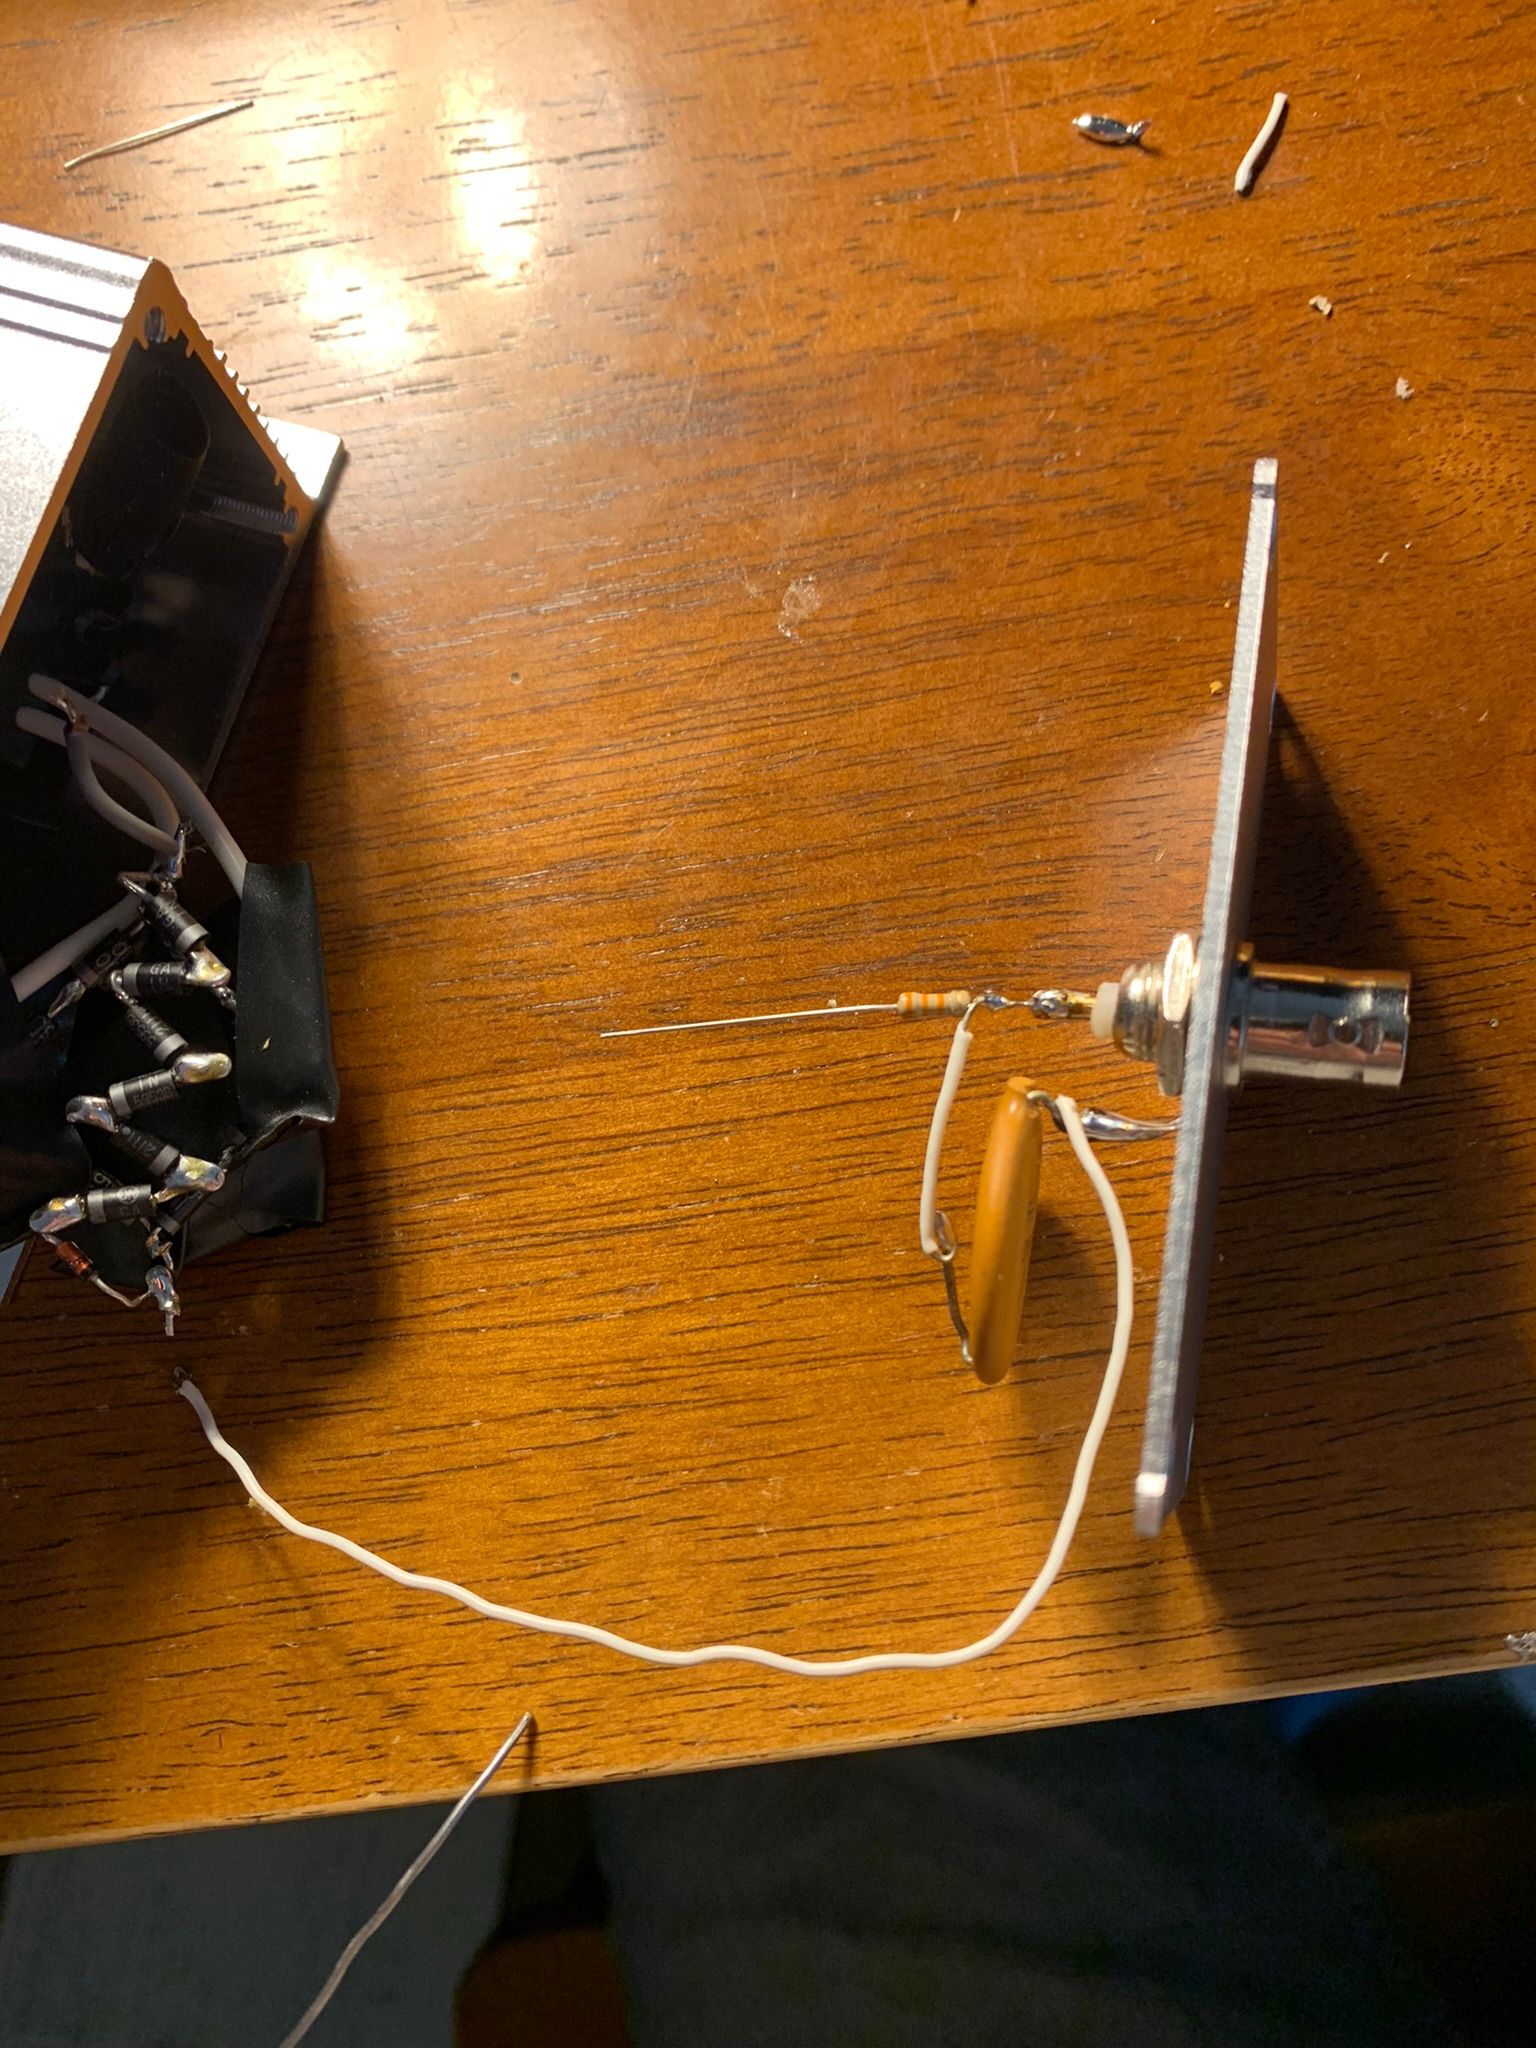
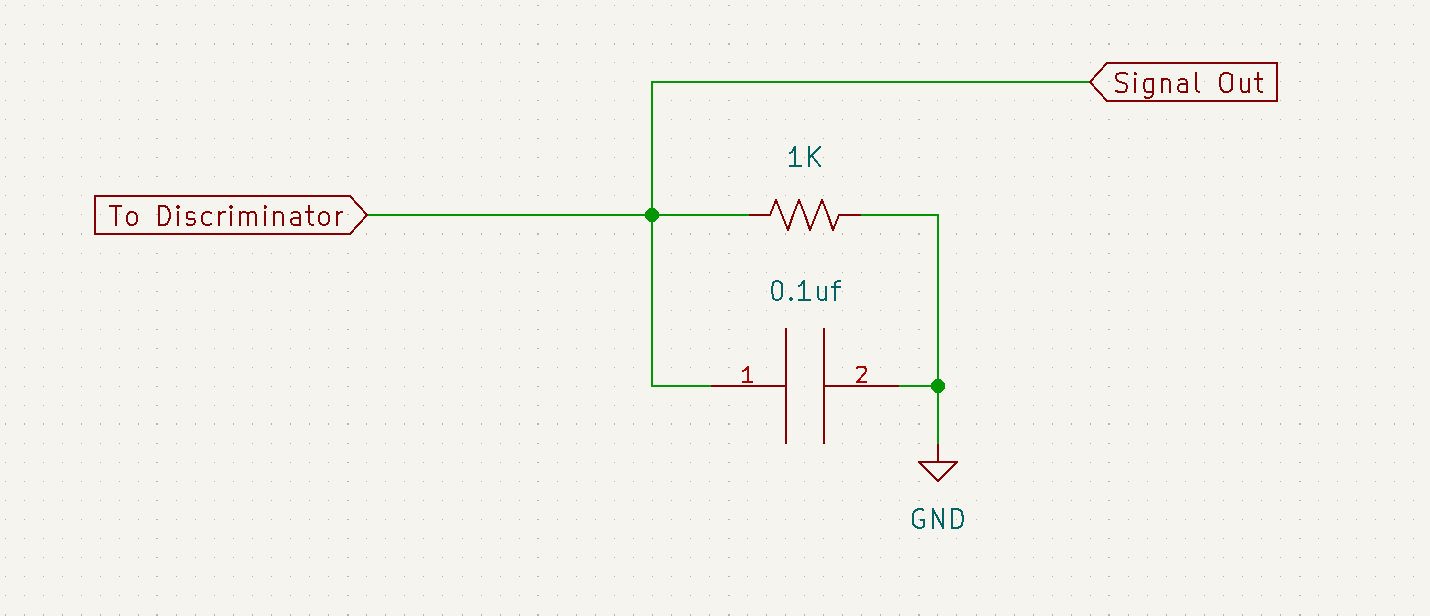
To get the -9V required by the preamp, I simply wired the positive end of a 9V wall adapter to the common of the high-voltage power supply circuit and the negative end to -9V input on the detector. The outputs of the wall adapters were isolated from the mains prongs and didn't have earth ground connections, so doing this worked out fine. The final power supply circuit looked something like this:
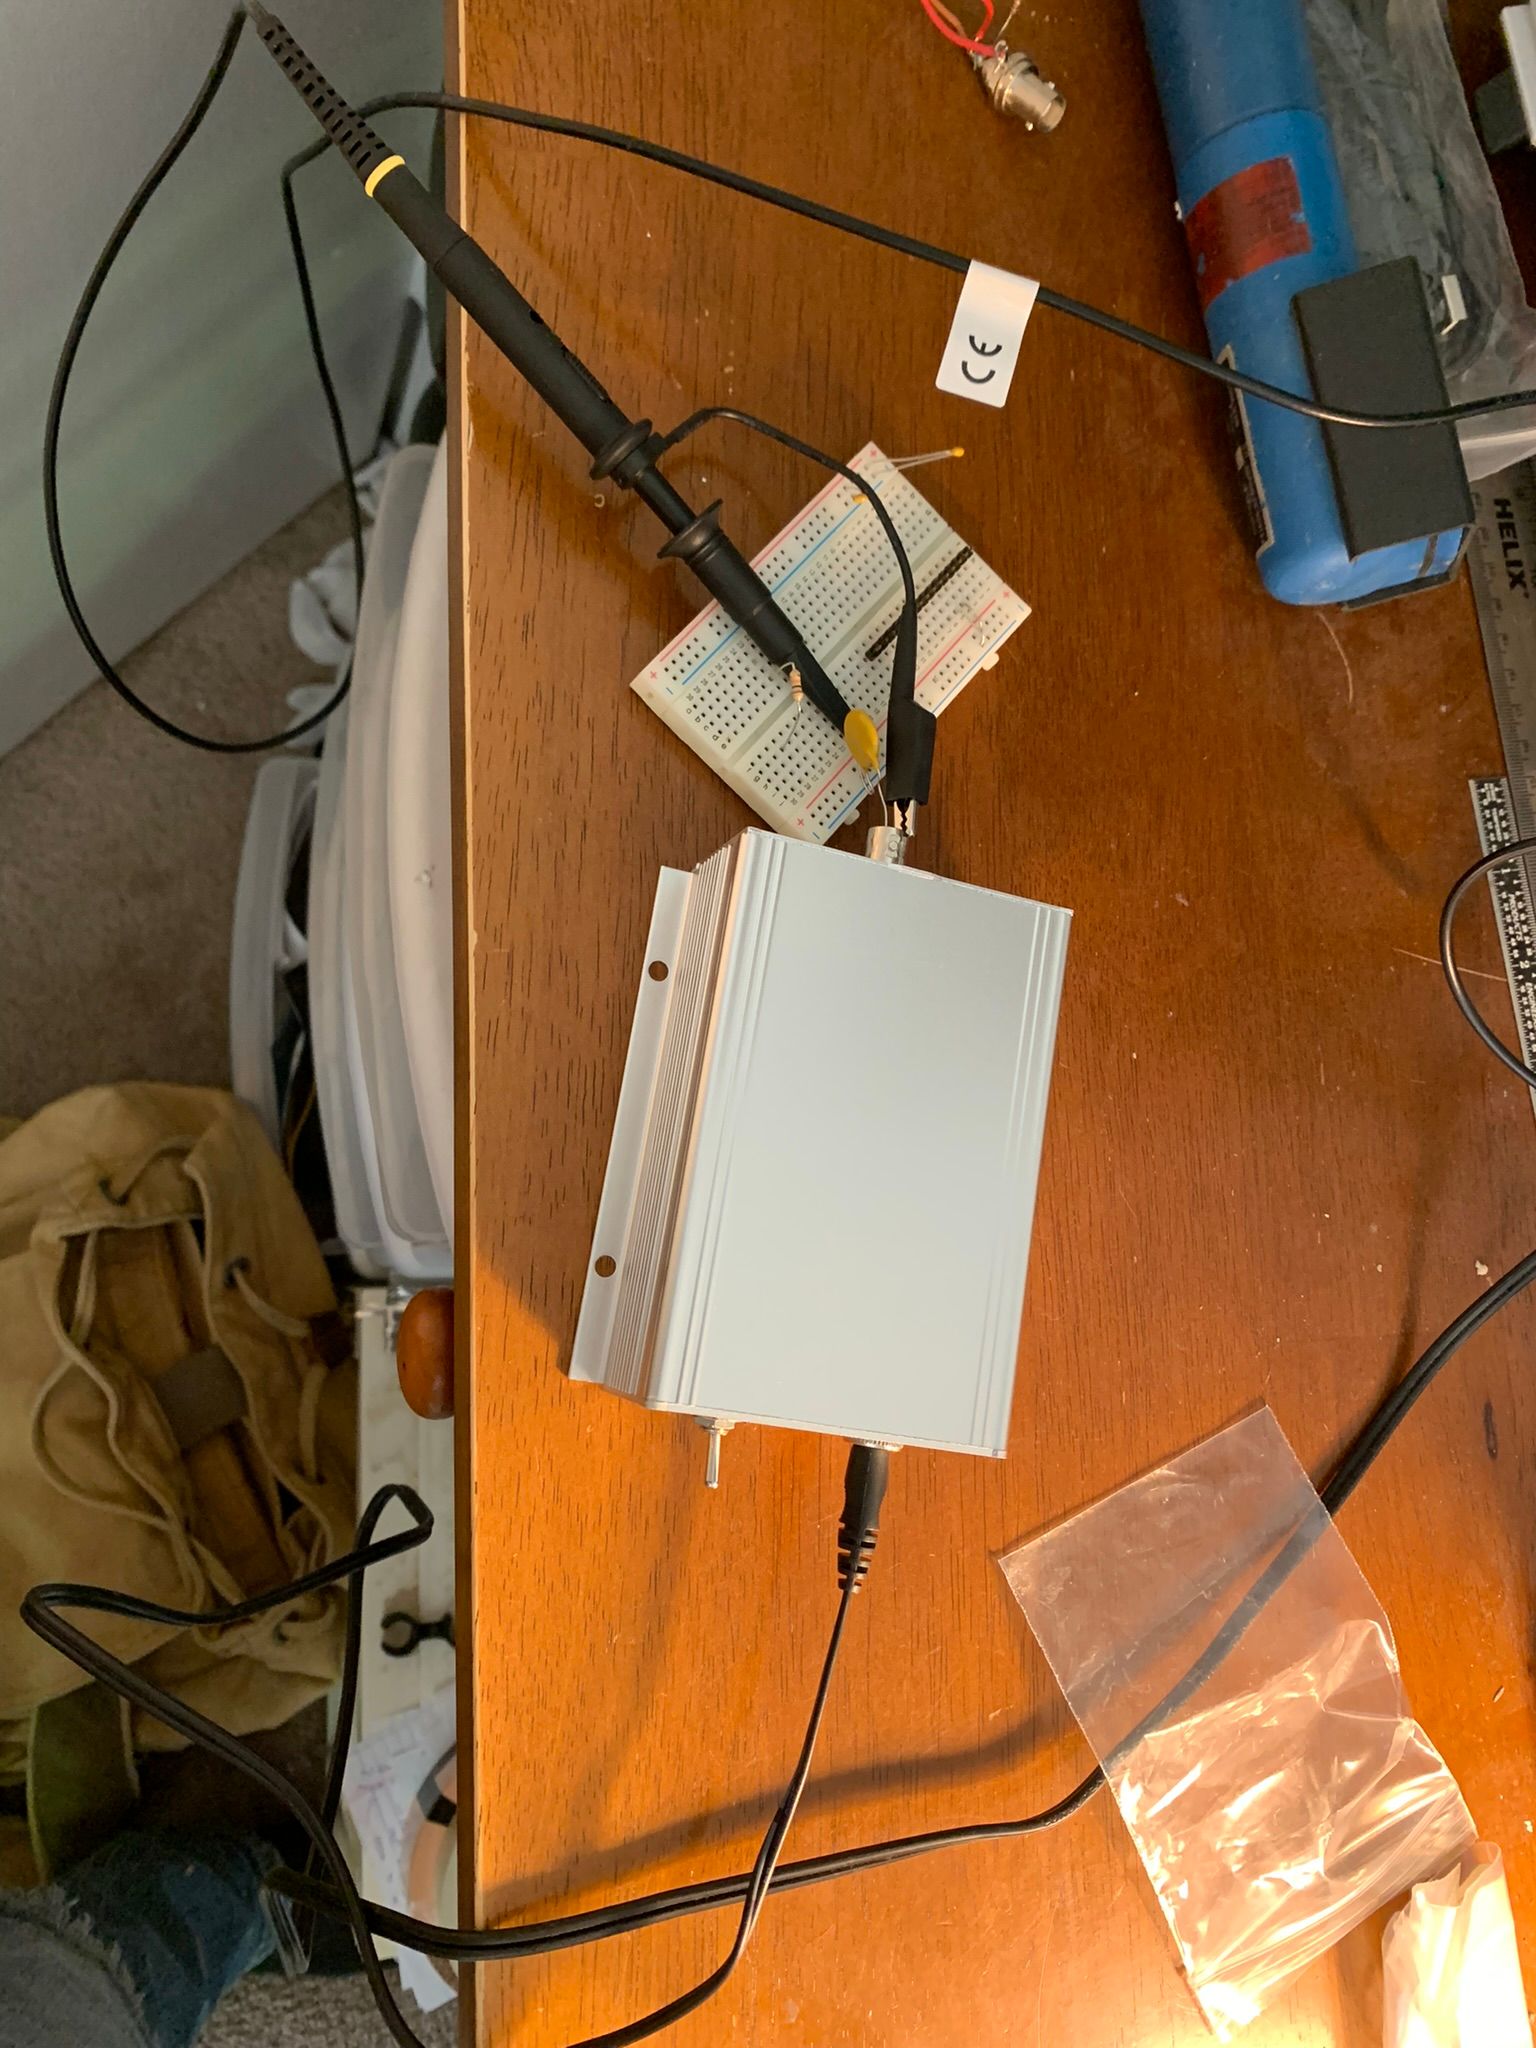
I used a 0.9 microcurie Am-241 source from an ionization smoke detector to test the detector. I don't condone or encourage taking apart smoke detectors, but it is what it is, and those sources are going to end up broken apart in the trash one way or another.
To convert the output of the preamp from a current to a voltage, I simply connected it to a 1K resistor going to common, and measured the voltage across that resistor. I noticed high-frequency noise could sometimes trigger my oscilloscope even when there was no pulse due to radiation. Sometimes this would correspond turning a light on or off or my refrigerator compressor kicking on, which was interesting, but sometimes it seemed random. I threw an extra 0.1 microfarad capacitor across the 1K resistor to stretch out the output pulse and give it a nice RC time constant that would make it easy to pick out from high frequency noise. This wouldn't be great for high count rates, as it would lead to excessive pulse pileup, but because I'm anticipating extremely low count rates, it's totally fine.
It looked like all my circuitry was performing well enough, even if it wasn't perfect. So I haven't made any major updates from what's presented here.
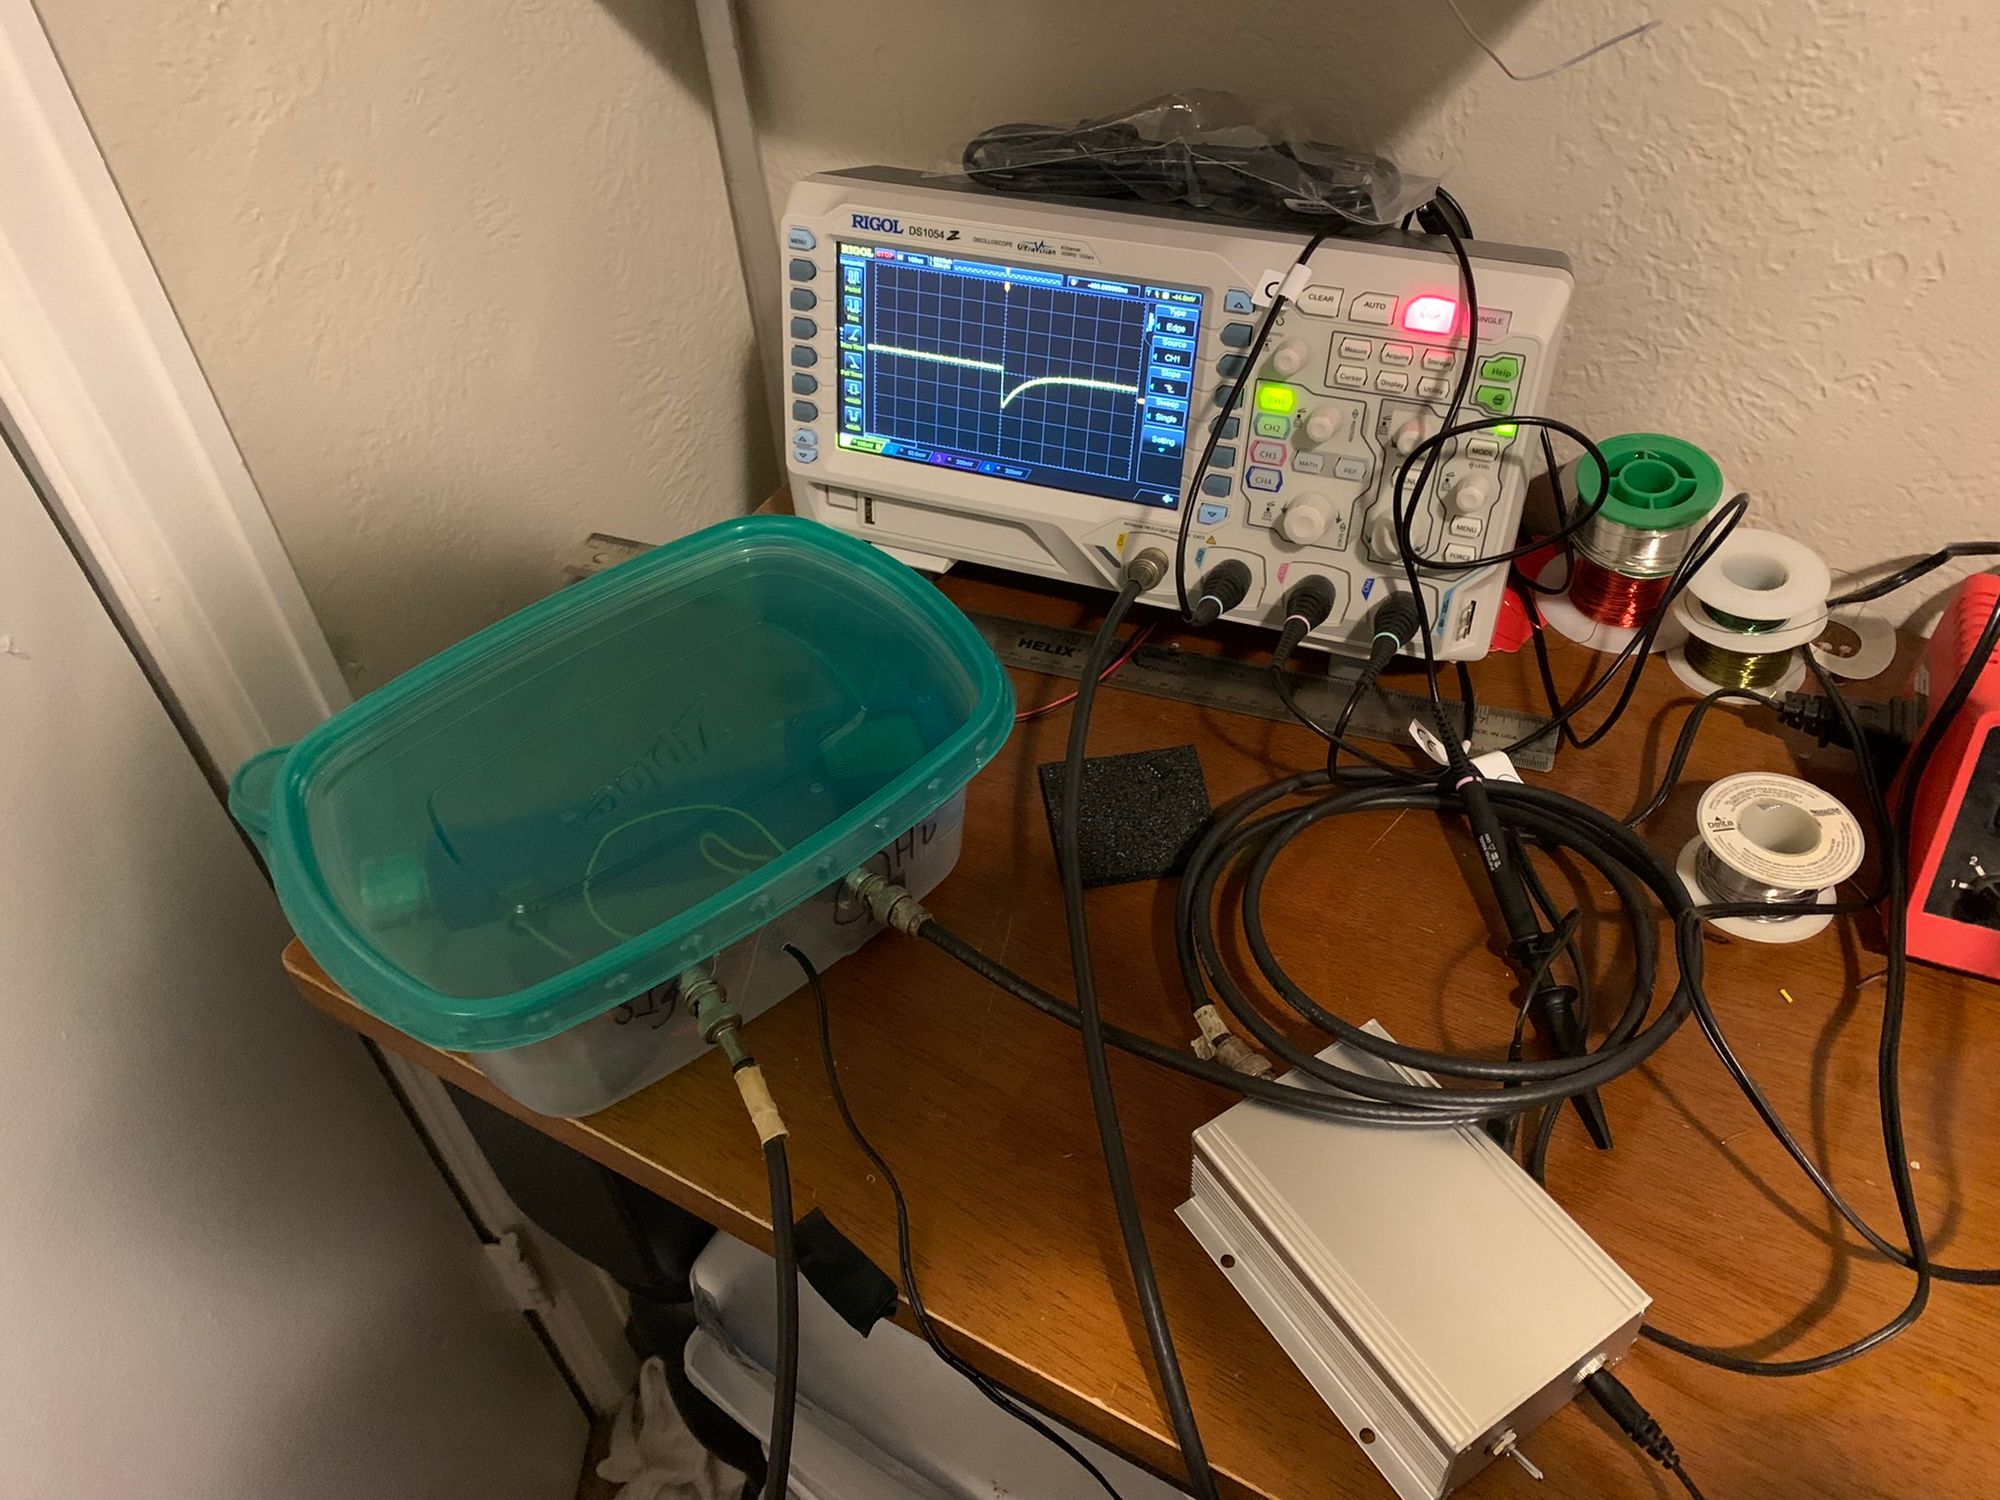
Based on this testing, it was clear that radon background was actually a lot higher than I was anticipating, and might actually be a problem, even at 0.1-0.5 counts per minute. It might be possible to enclose the sample being measured close to the scintillator to shield it from radon decays in the air immediately around it, but I had another idea. Radon-222 has a half life of 3.8 days, so if it came to it, I could put the detector and sample in a sealed container and wait a week or two for the radon within the container to decay away before beginning the measurement of the sample. What better air-tight container to use than a Tupperware?
Even if there were ways around it for the sake of the measurement, I was surprised by how high the radon levels appeared to be in my duplex, which sent me down a bit of a rabbit hole I did not expect be going down.
Initial Radon Concentration Measurements
I decided to do a really quick back-of-the-envelope calculation to determine whether Radon could reasonably account for the background count rate I was getting with this detector.
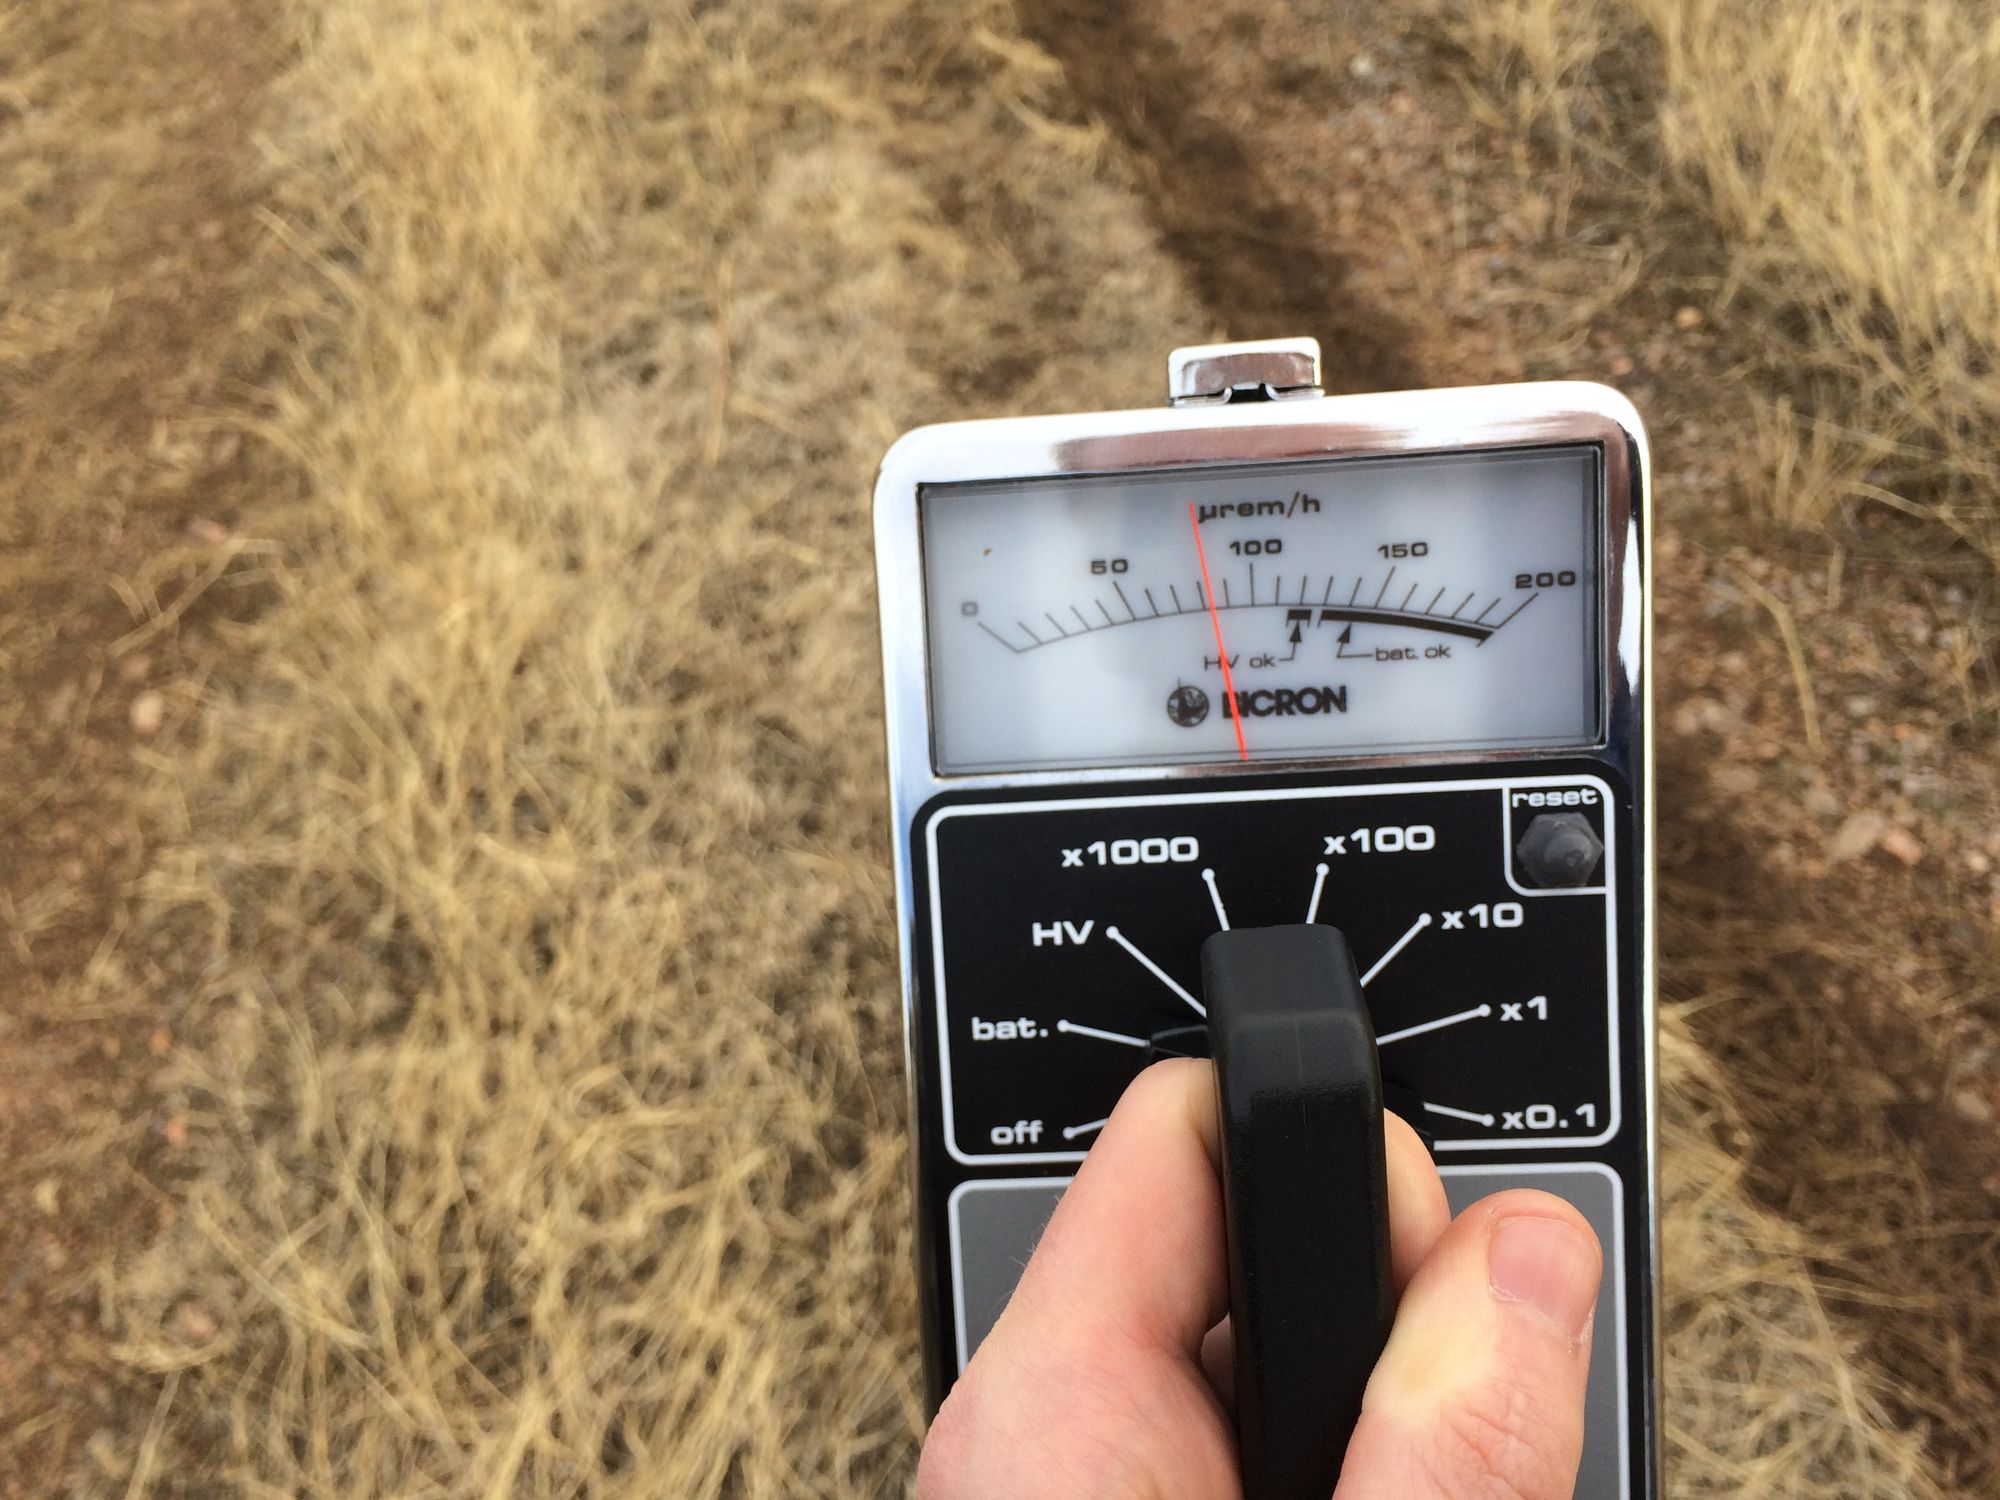
I used the single-shot trigger mode on my oscilloscope and the stop watch on my phone to measure the time between a few radon pulses from the detector. If a pulse was clearly from noise rather than the detector (this was easy to determine based on the pulse shape), I wouldn't count that pulse and would reset. This certainly wasn't the most precise measurement I've ever done, but it gave me a rough approximation of the background count rate from the detector.
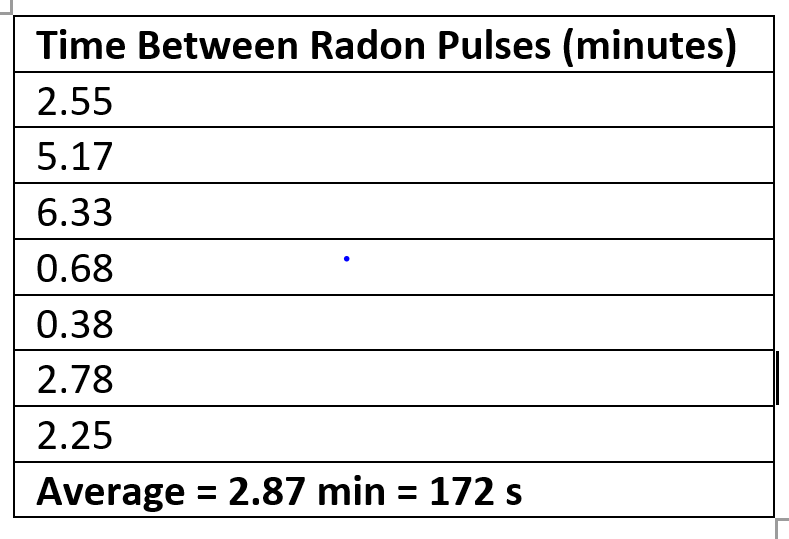
Using the data above, I determined that the average count rate from the detector was 1/172 = 5.81E-3 counts/s.
Now here's where some some generous assumptions and approximations come in. Because alpha particles can only penetrate a few centimeters of air, we know that all of those counts were from radon decays within a small layer of air right above the scintillator window. I measured the largest distance I could hold an Am-241 source above the window while still registering counts to be about 2 cm. The window itself was about 3.175 cm x 4.765 cm, so the volume of air from which the detector was sensitive to radon decays is roughly 3.175 cm *4.765 cm * 2 cm = 30.24 cubic centimeters. We'll just call that 30 cubic centimeters since this is only a very rough order-of-magnitude calculation.
Now that we have a rough idea of our source-detector geometry, we need to account for the fact that not all alpha particles will be emitted in a direction that intersects the scintillator window. This concept is generally called geometric efficiency. In this case, since the source is a thin rectangle right on top of the detecor, we'll approximate the geometric efficiency as 0.5. That is, we assume all alpha particles emitted in the downwards direction (roughly half of them) will strike the scintillator. This is approximately true for planar source-geometries when they are very close to the detector. I'll admit calling the volume of air we are considering planar is a bit of a stretch, but it should be good enough of an approximation for now.
Ordinarily, we might want to account for the intrinsic efficiency of the detector (i.e. given that a particle strikes the detector, what is the probability it will be registered as a count), but the intrinsic efficiency of alpha scintillators are practically 100%. It's true that there is some self-attenuation within the air itself, but we'll assume we accounted for that well enough when we measured the thickness of the volume of air.
So, here it goes. To determine activity within the volume of air, we simply divide the count rate by the geometric efficiency. 5.81E-3 counts/s / 0.5 = 1.16E-2 Bq. The units of Bequerels (abbreviated to Bq) simply means decays/s.
Now we can divide the activity we just calculated by the volume of the air to determine the radon concentration. 1.16E-2 Bq / (30 cubic cm / 1000 cubic cm / L) = 3.875E-1 Bq/L. Radon concentrations are generally given in units of pCi/L, so we can convert Bq to pCi using a conversion factor of 27.027 pCi/Bq. This gives our final radon concentration of roughly 10.44 pCi/L
(Update: This methodology is a very poor estimate of radon concentration since it includes counts from radon daughters as well. Much more on that below.)
That is actually really high. About an order of magnitude greater than the national average of 1.3 pCi/L. Of course, the measurement methodology described above is riddled with potential issues, but according to a fact sheet released by the CSU Extension, the radon concentrations in the average Colorado home is 6.3 pCi/L, well above the national average and not too far off from my approximate measurement. This can primarily be attributed to the high uranium concentrations in Colorado's soil, which decays into radon that can diffuse into homes through cracks in foundations. My duplex actually has a crawl space with a dirt floor, so there is practically nothing to prevent radon from diffusing into the main living space. Furthermore, there is no forced circulation, so once the radon gets in, there isn't much to remove it. This is particuarly a problem in the winter when we keep all our windows closed.
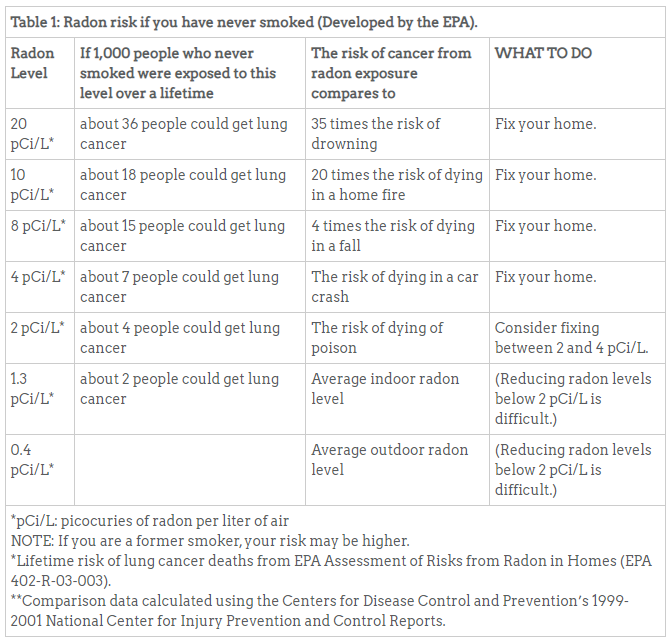
I'll be honest. I'd never given radon much thought before taking on this project, which made it impossible to ignore. I can only imagine most people think about it even less. Nonetheless, the statistics regarding the risks associated with radon are sobering. This is especially bad considering how often I work from home. According to the chart below, my risk of death from radon exposure actually exceeds my risk of death from a car accident, which is a little bit bonkers. And it's even crazier that that fact may well hold true for the majority of Colorado residents. Of course, most people don't spend 100% of their lives in their homes, so just because your home has high radon doesn't mean the chart below accurately reflects the risk you're exposed to (I've been meaning to go through the risk calculation myself with some more realistic assumptions), but it really highlights how disporportionately little attention this problem gets given how many deaths it is responsible for.
That said, I knew I probably shouldn't freak out about my very questionable measurement without validating it somehow. So, I went to the hardware store and picked up a standard radon test kit.
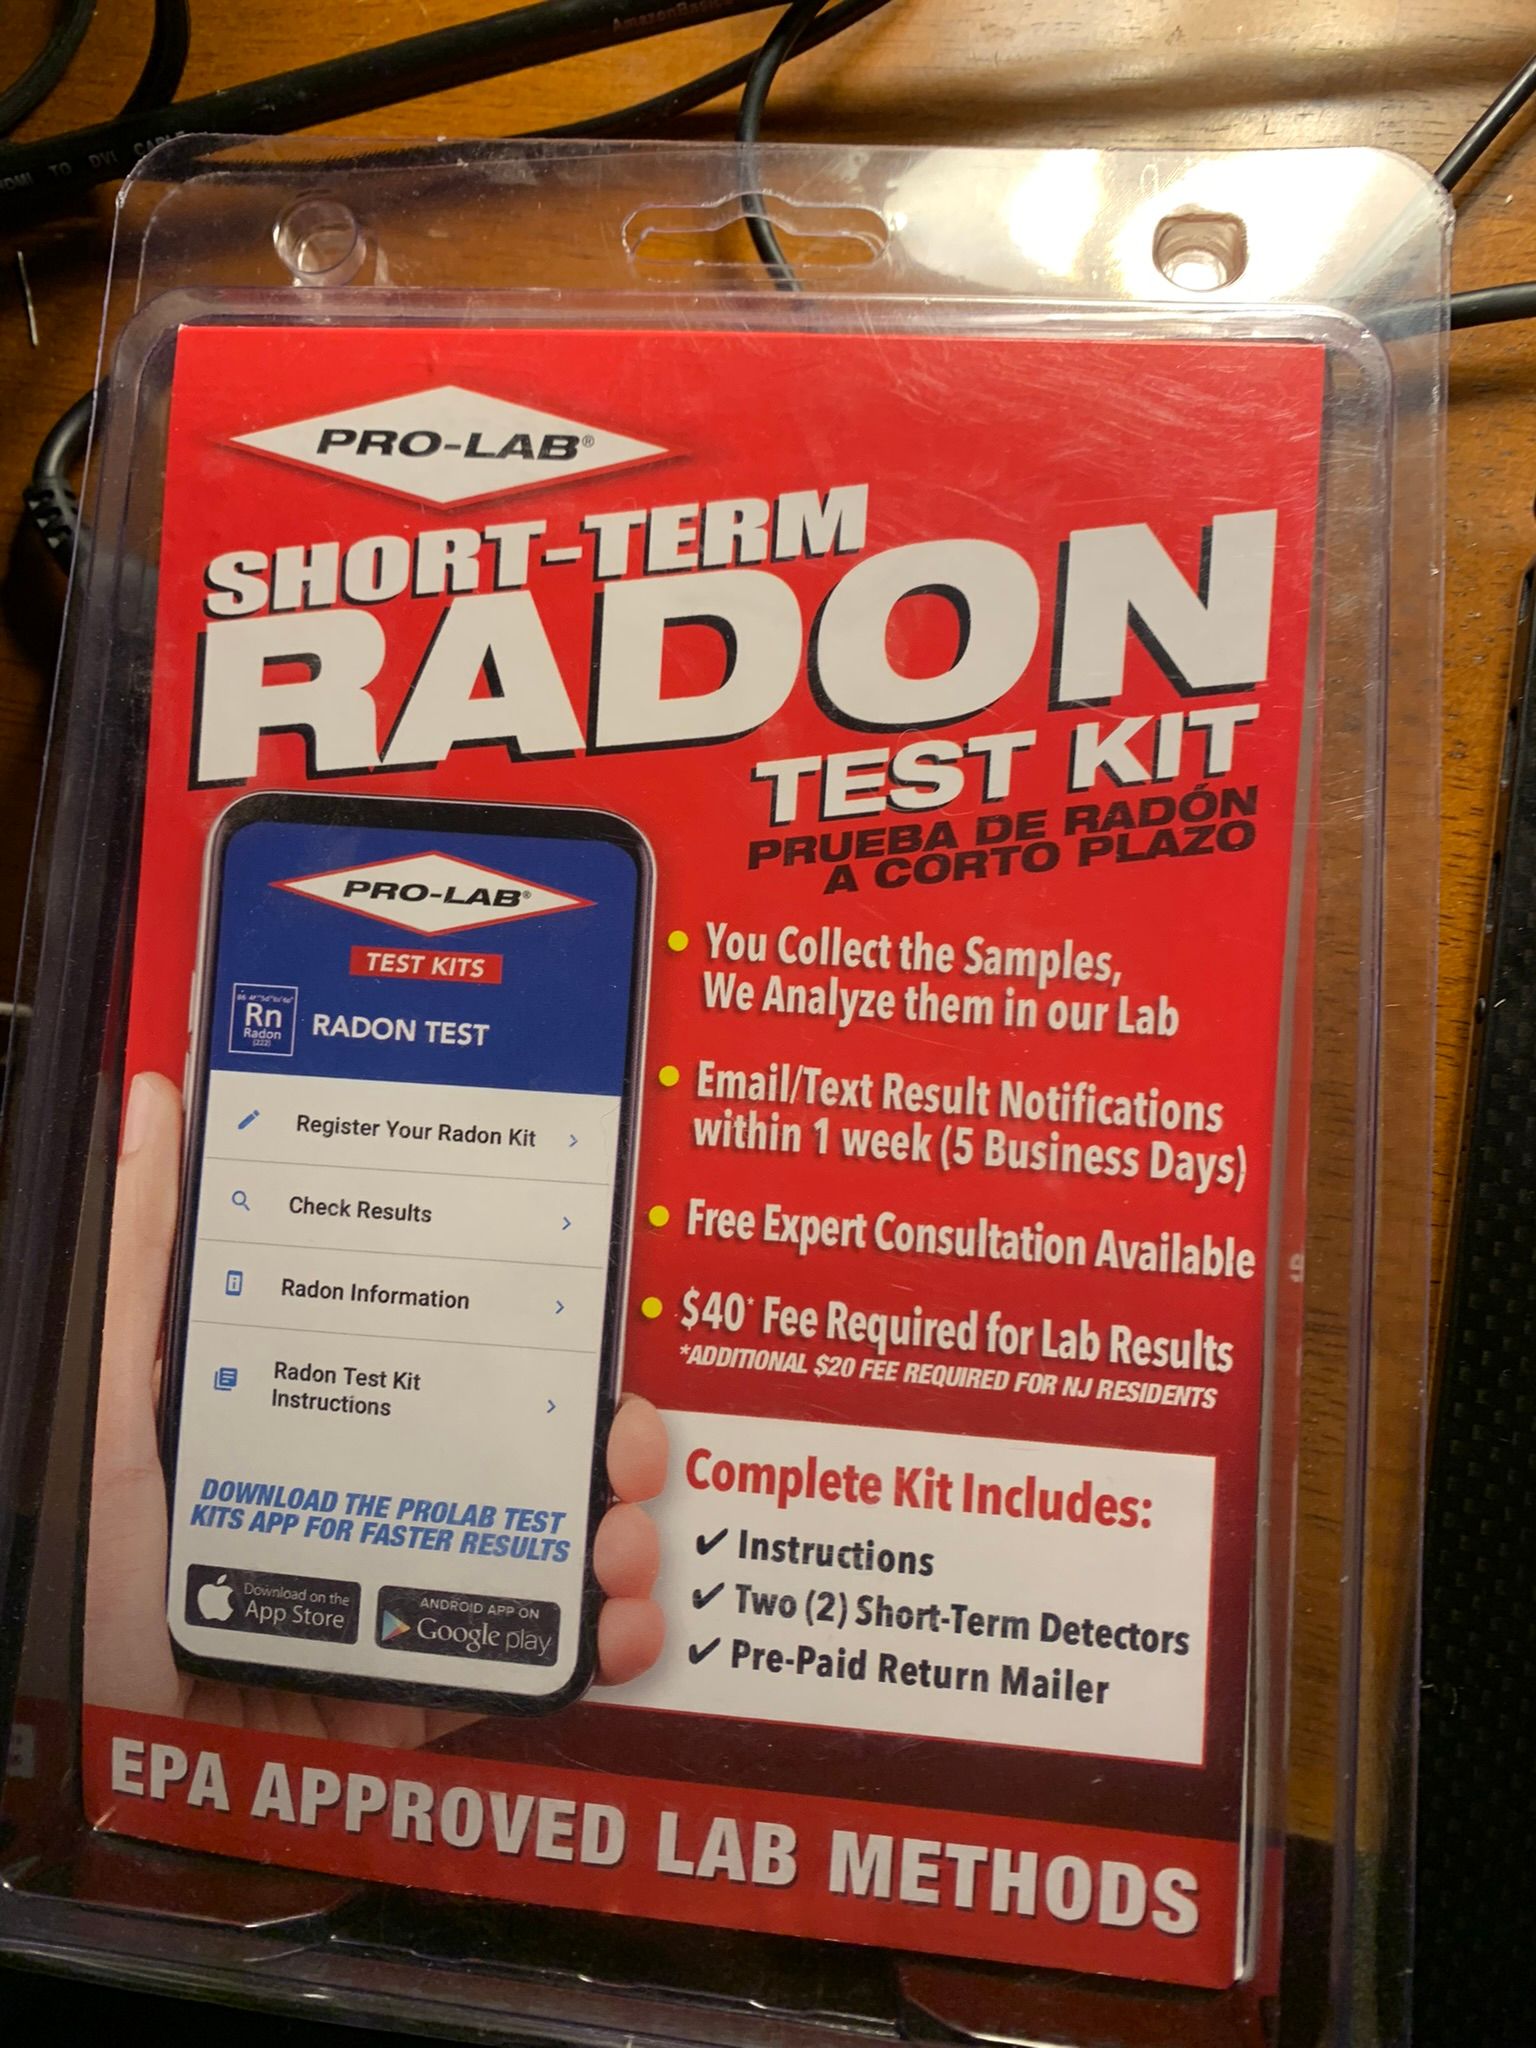
I had never performed a radon test before, so this process was very educational for me. Just from reading the packaging of the test, a few dissapointing facts were immediately clear.
First, these tests are actually fairly expensive. The test kit itself was about $13, which isn't too bad, but that only gets you the supplies to collect two samples from your house. To actually get a measurement from those samples, you have to mail them to a lab and pay an extra $40 ($60 if you live in New Jersey, for some reason...). That's $53 to get a single measurement from a single room in your home at a single point in time. It's easy to see how expensive it could get to perform comprehensive measurements of your home, especially if you had to do it more than once (e.g. before and after installing mitigations).
Second, the process is quite time consuming. While these are "short term" test kits, collecting the sample takes 48 to 96 hours, plus a couple days to mail the sample, and a few more days to recieve results from the lab. That isn't so bad compared to the long-term test kits, which perform a measurement over the course of several months, but it's still on the lengthy side in my opinion. Consider that the approximate measurement I described using my alpha scintillator took about an hour (of course, it could have used more integration time, isn't an EPA-approved method, etc., etc.).
Regardless, I setup the detectors from the test kit as per the instructions and let them sit.
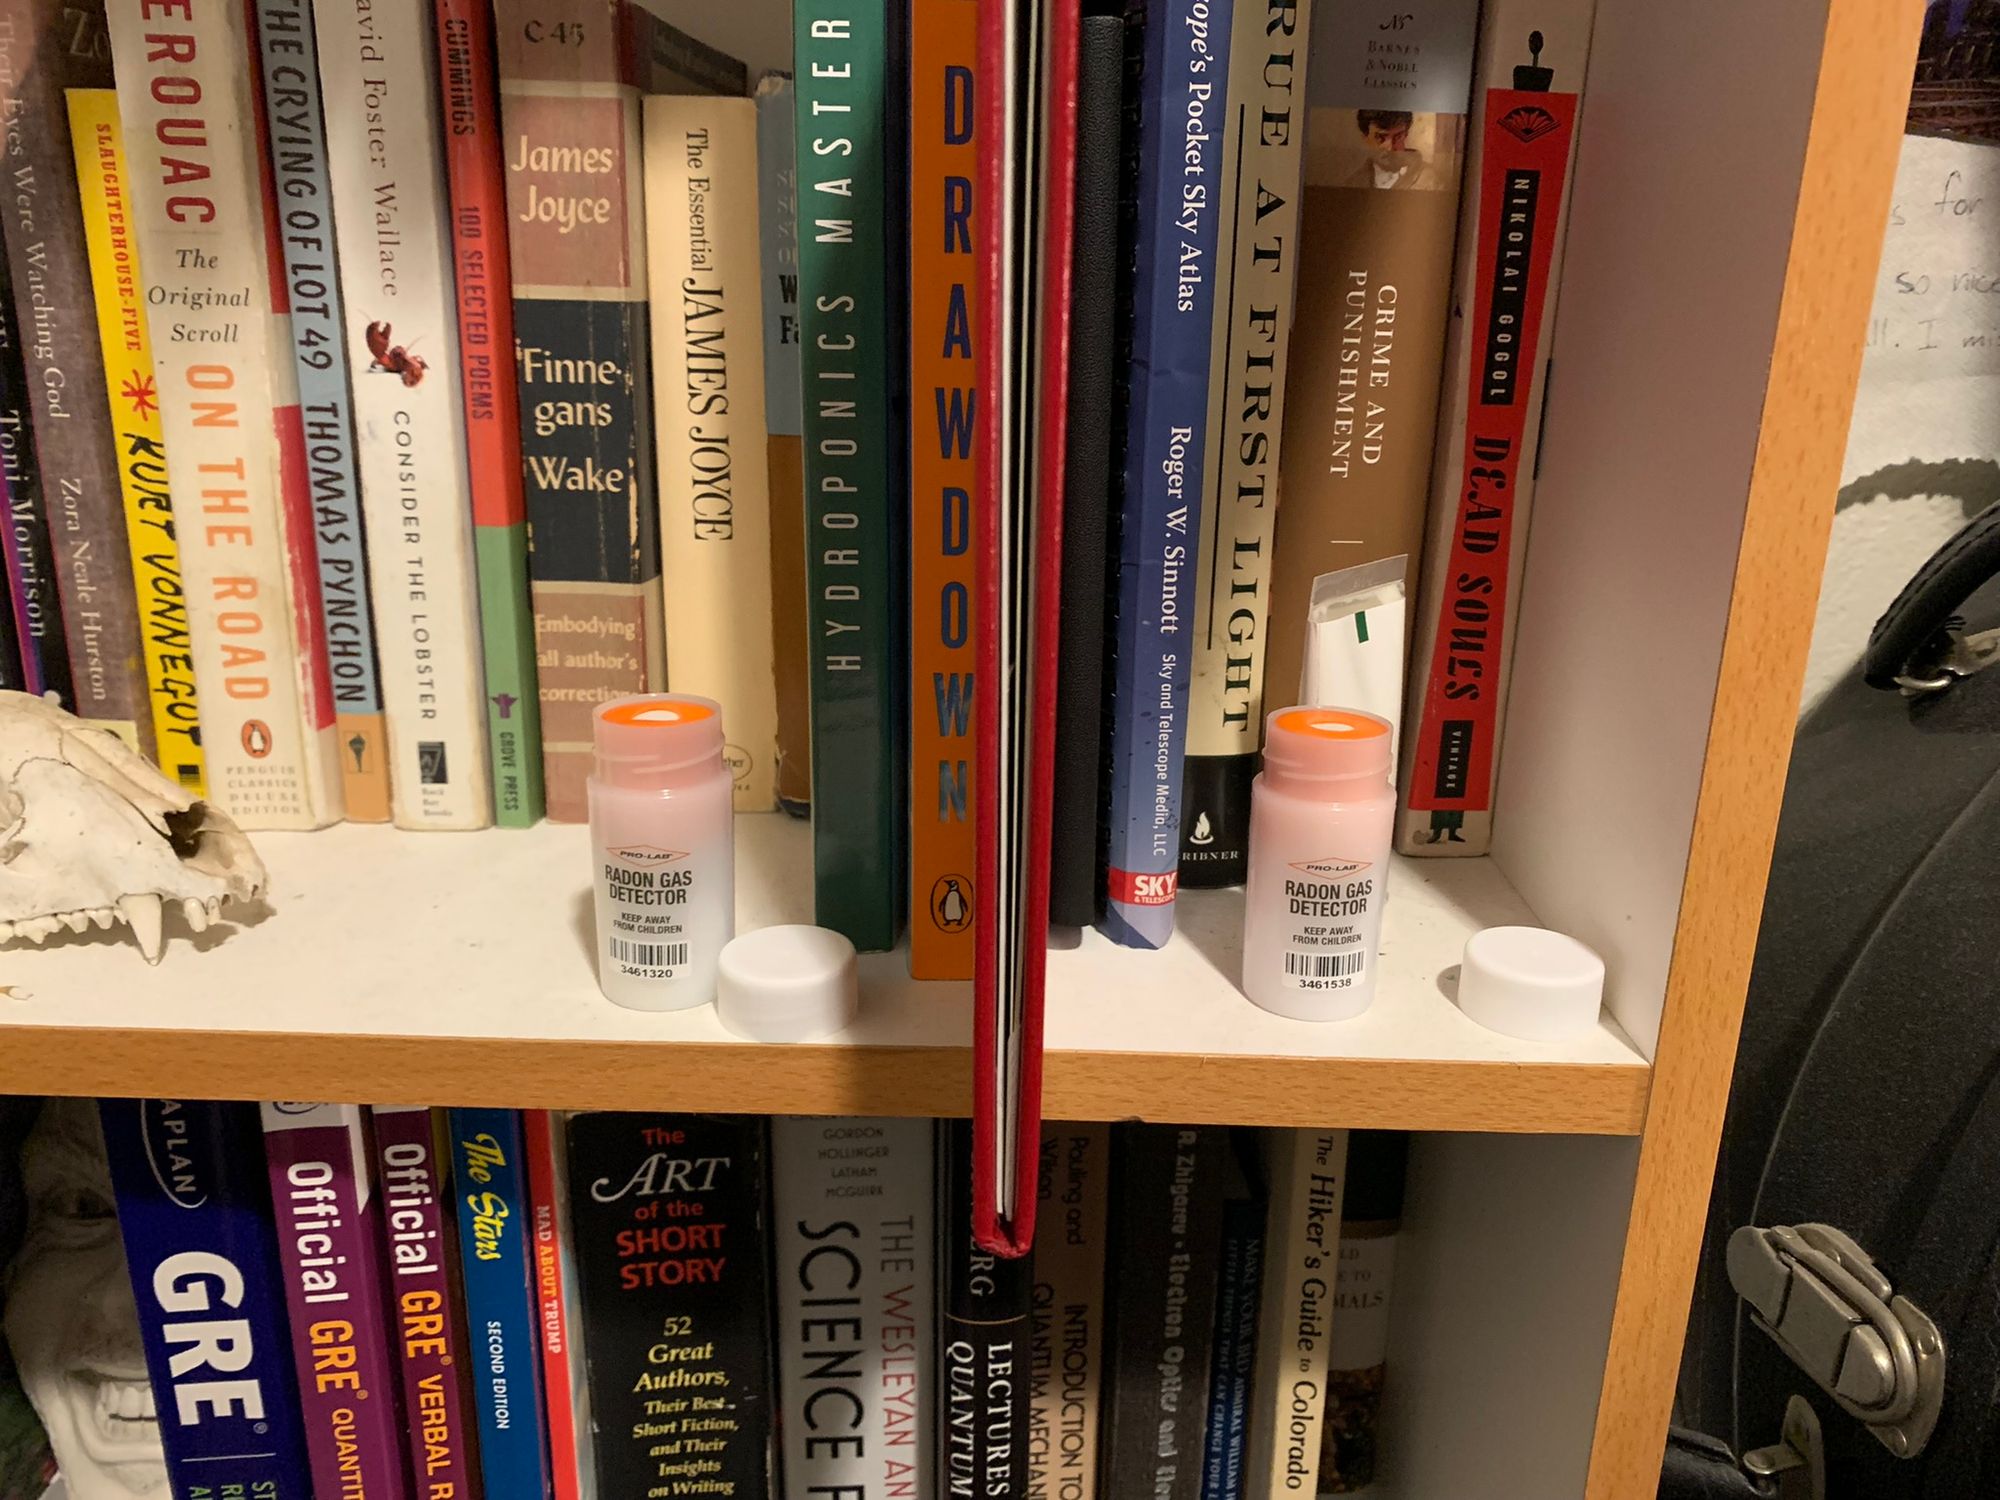
After about three and a half days, I sealed the detectors, placed them in the mailer that came with the kit, and drove to the post office to drop off the mailer.
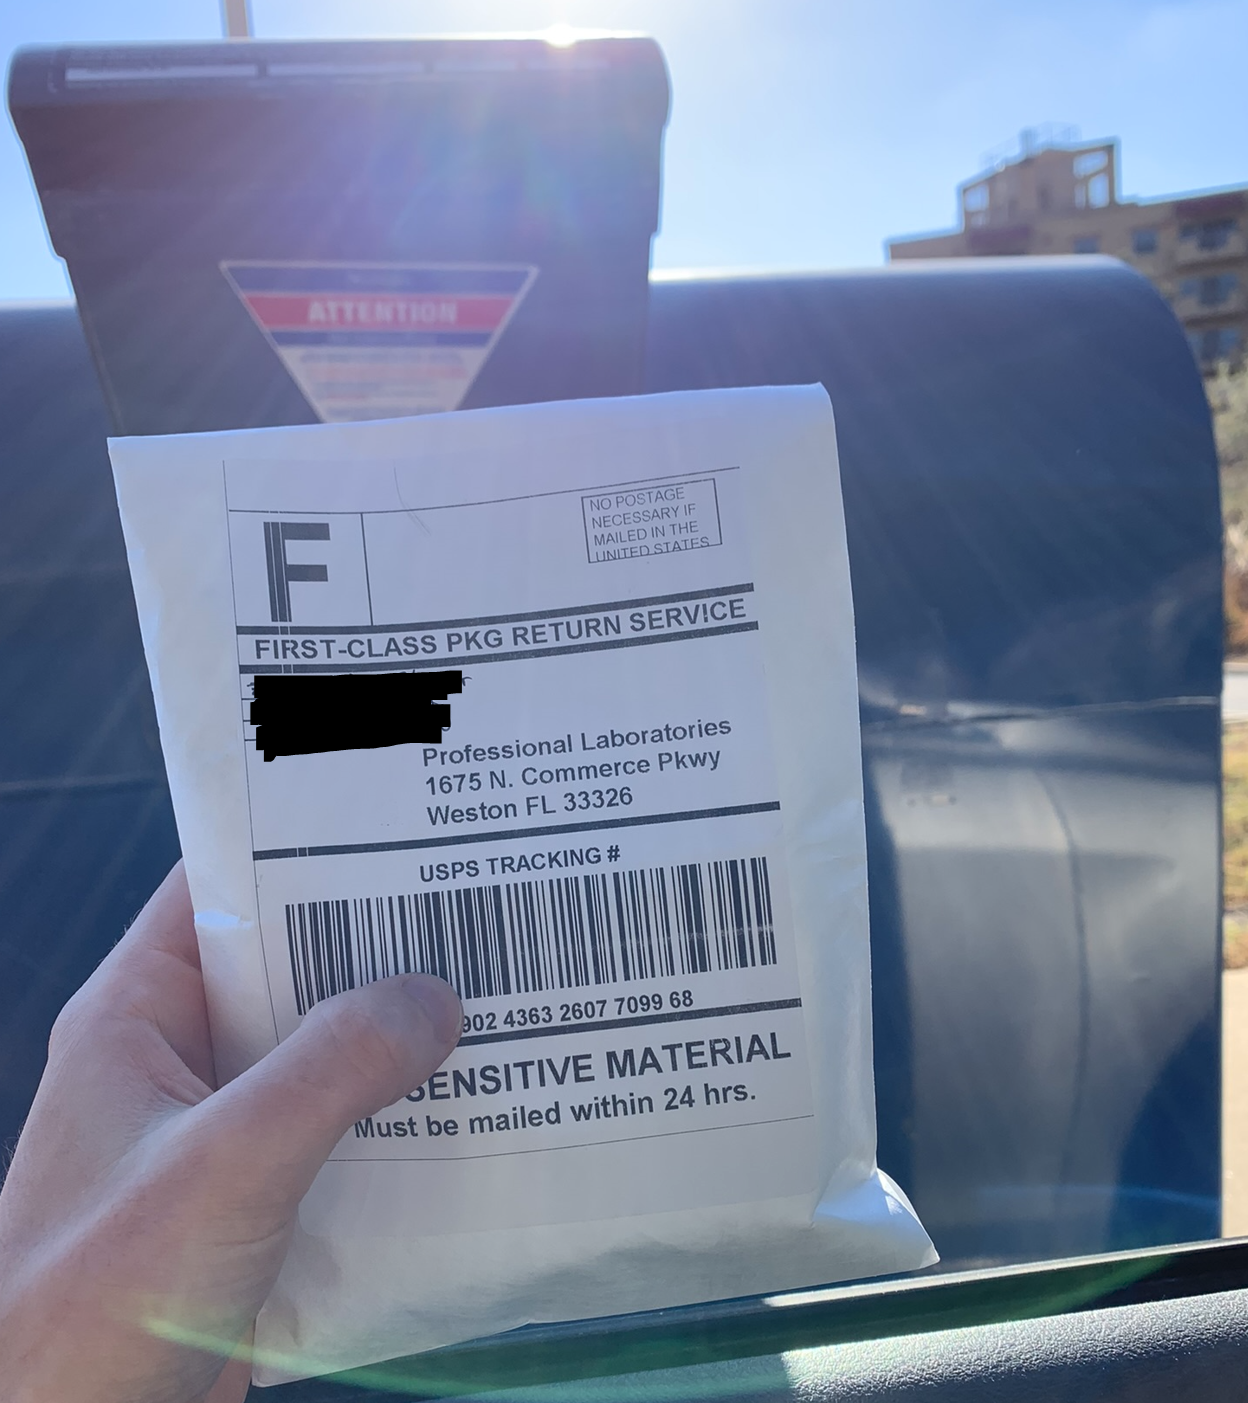
About 4 days later I received an email from the lab saying that they had gotten my samples, and I was charged the $40 lab fee. Two days later, I got an email with the results of the test attached.
The whole process cost me $53, took a little over a week, and required me to drive to the hardware store and the post office. I suppose that isn't too bad, but it seemed a little pricey and involved to me.
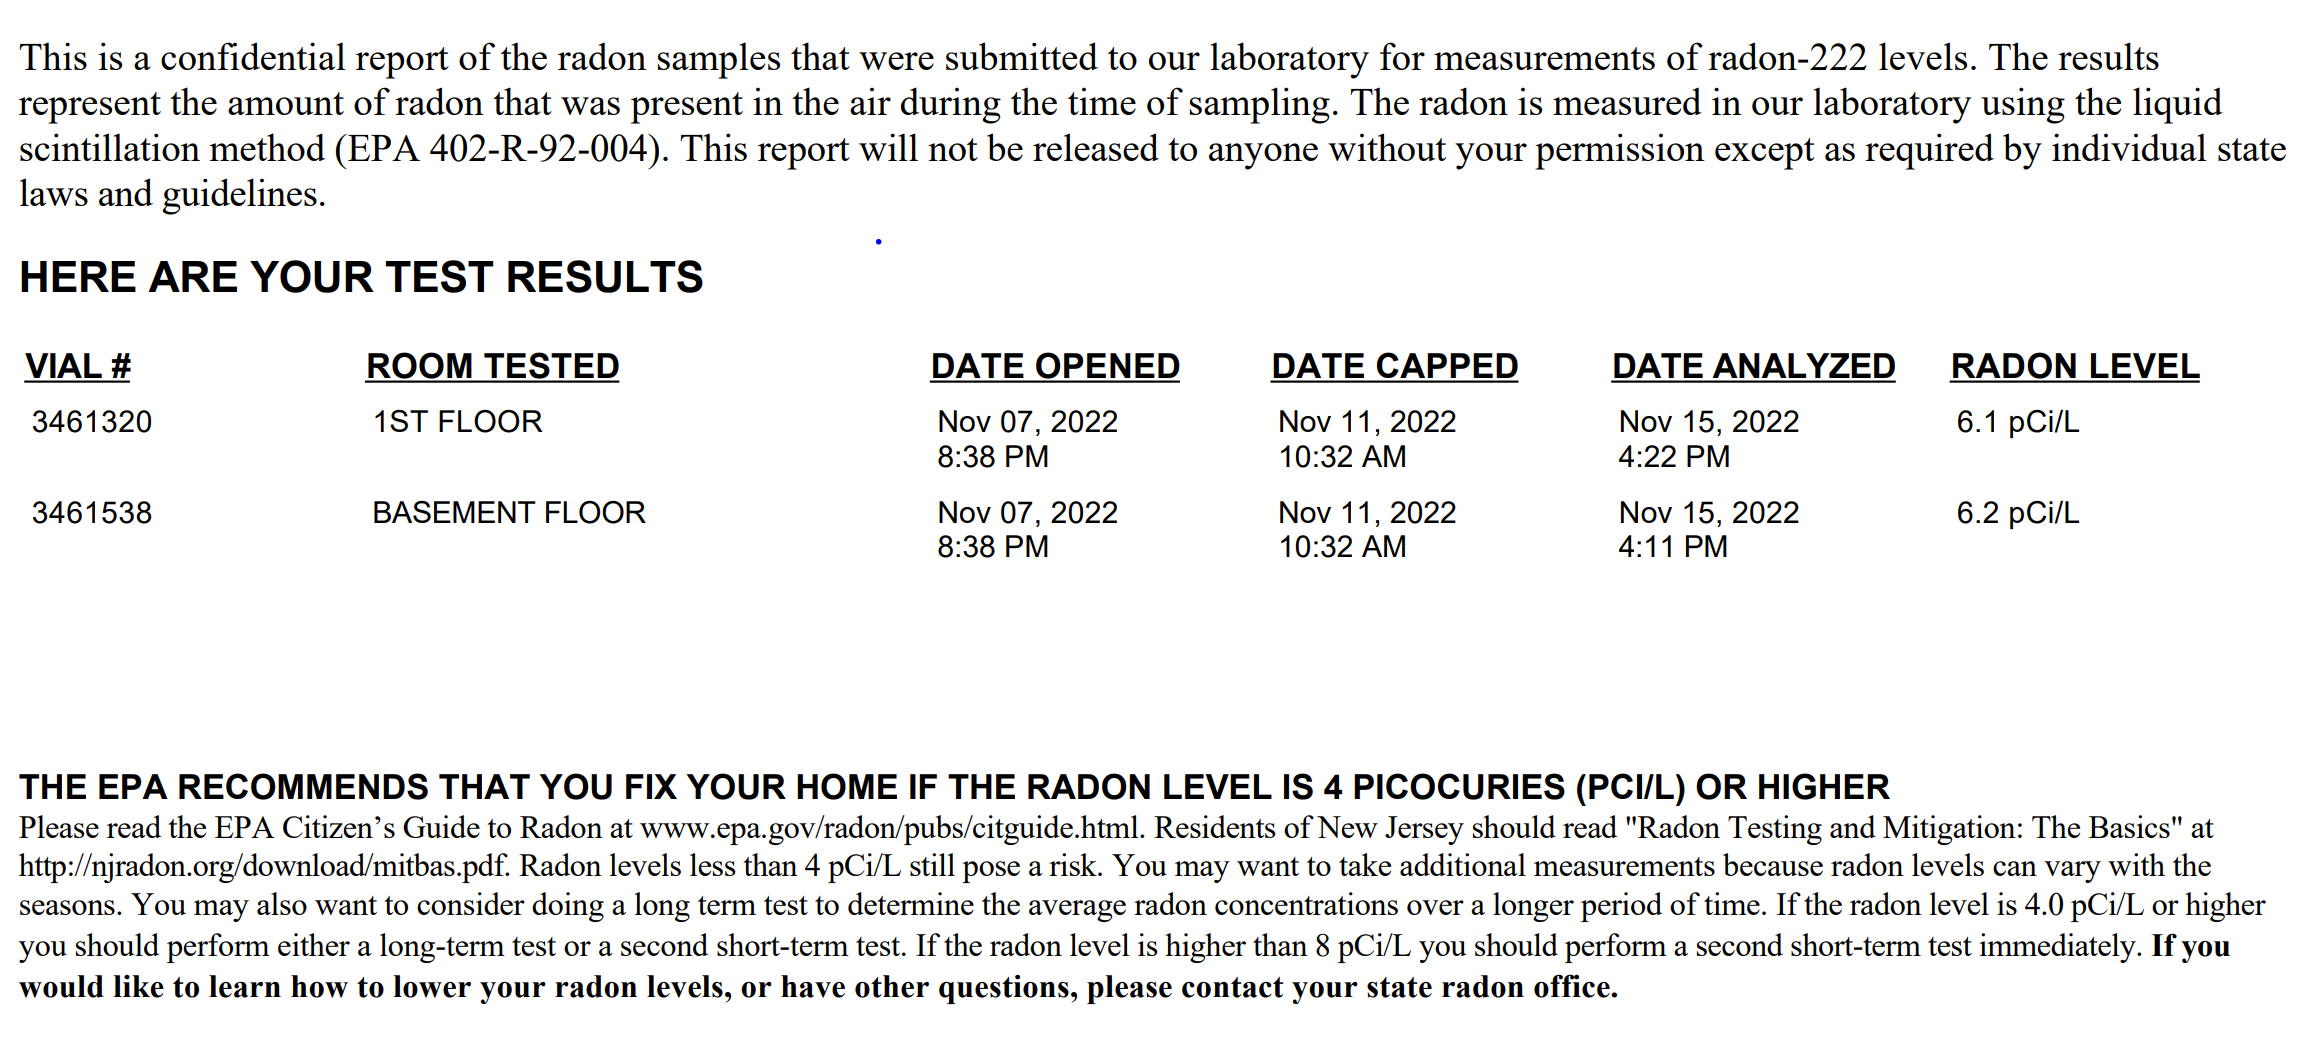
As you can see from the results above, the test kit indicated that the my radon concentrations were right around 6.1-6.2 pCi/L, right in line with the concentration of the average Colorado home cited by the CSU Extension and well above the EPA's recommended threshold for installing mitigations. More importantly for me, it wasn't too far off from the value I estimated using my scintillator.
At this point, I had deviated pretty far from the original experiment I had in mind for this detector, but I was glad I did. Radon is a real issue that costs real lives, and finding a method of quickly and cheaply measuring it could actually have real value. Plus, I found myself learning a ton about radon, which I never would have been motivated to do otherwise.
Obviously, not everyone has access to surplus alpha scintillators, and even if they did, it probably wouldn't be very cost competitive. This did get me thinking about a cheaper and more easily mass-produced alpha scintillator that could much more easily find its way onto hardware store shelves. I did find some existing detectors that are sort of like what I have in mind, but I think I might be able to design something a bit cheaper and more accurate; However, that's a completely different project for the future. If nothing else, this detector can serve as a proof of concept for a ZnS(Ag) scintillator-based radon detector.
I have a few thoughts on what caused my measurement to err on the high side compared to the test kit. For one thing, my integration time was quite short. I based my count rate on only 7 counts, and the relative shot-noise associated with that would be very substantial. Aside from that, the test kit was designed to specifically measure radon-222 while my scintillator measures absolutely any alpha emitter within range. That could include additional nuclides such as radon-220, or any of the alpha emitting progeny of radon that could remain suspended in the air. I have a few experiments in mind that could help me isolate these effects and also potentially get me a more precise measurement of the radon background, but those will require a much more polished data acquisition system.
Pynq-based DAQ System
Reading Analog Values from the Scintillator
Once I got the detector operating, I wanted a way to measure counts from it that didn't involve my oscilloscope. These measurements would take days or possibly weeks to complete, and I'll probably want to use my o-scope for other things during that time. I do, however, have a Pynq-Z2 board that I've been really meaning to do something with but unfortunately has been gathering dust since it was given to me by a kind MIT instructor following my FPGA drum project.
The zynq 7020 actually has a pretty fancy ADC capable of operating in bipolar mode, so it's perfect for measuring that weird negative pulse coming out of the detector. It's true that I probably could have handled that issue by reversing which of the P or N ADC inputs are connected to the output BNC from the detector and read a positive pulse that way, but I think it's nice when you don't have to use janky tricks like that. I think I've used up all my leeway in that department already in this project. Plus, maybe I'll want to be able to measure both positive and negative pulses at the same time for something in the future. Who knows?
At the moment my plans are to have some logic in the FPGA fabric sample an ADC as fast as it will go (1 MSPS, in this case), and constantly check if it has exceeded a threshold value. If it has, it will buffer all the samples above the threshold in a FIFO until a python program running on the processor has a chance to drain the FIFO and save the data to the SD card. Eventually I might also want to incorporate a time-over-threshold filter as well to reject high frequency noise, and if it comes to it I could do some extra fancy pulse-shape-discrimination to really be sure I'm not getting any counts from noise, which could be important for these extra long measurements where I'm expecting very, very low count rates. Even a handful of false counts could screw things up. So long as I can store the pulse data with relatively high fidelity, I can at least confirm post experiment if noise interfered with the measurement.
I will admit, that for right now, throwing an SOC at this project is massive over kill. But if I end up doing some sort of fancy pulse shape discrimination, it could be justified. I mostly just wanted an excuse to finally put the pynq board to some kind of use and to keep my verilog skills sharp.
I had never written an overlay for the pynq board before, though I had previously loaded the pynq image onto it, connected it to my router, and ran some python on it.
To make an overlay, you have to make a Vivado project with an appropriate processing system in the block design, and from there you can drop in your own custom RTL and connect it to the processing system using an AXI4 interface. There are ways to connect AXI4-stream interfaces or use shared memory, but I haven't gotten that far yet. I won't go into too much detail on the basics of making an overlay because there are plenty of excellent tutorials out there already. I got my bearings by following a series of tutorials by Cathal McCabe. I had the benefit of 1) knowing verilog pretty well going into this and 2) having worked with Vivado block designs a small bit for work before, but McCabe's tutorials really got me comfortable starting them from scratch, and before long I was loading my own custom hardware designs onto the pynq board and interacting with them on a jupyter notebook.
From this point on, it might be helpful to reference the github repo I linked at the top of this post. That is, if you're the sort of nerd who cares about this sort of thing.
I started by writing a simple verilog file called axi_registers.v. All this module really does is run an AXI-lite bus that connects to the processor via an AXI SmartConnect IP. This saves some of the headache of having deal with all the AXI4 signals, but even AXI-lite has quite a few. The axi_registers contains a few registers mapped into an 8-bit address space (I didn't anticipate needing very many). Figuring out an elegant way to handle write collisions between the PS and PL was not my first priority, so I simply allocated addresses 0-127 to be read-only for the PS and addresses 128-255 to be read-only for the PL. Both PS and PL can read the entire address space. That way, both PS and PL can write data that the other can see without worrying about them both trying to write the same register at the same time. This does limit some functionality, like if you wanted to have the PS, say, set a bit in a register to signal to the PL do a task and then have the PL clear that same bit once the task is complete, but in most cases there are ways to work around that limitation, and if it really becomes an issue, I can put more time into it later. I don't claim for it to be the most clever or efficient communication scheme, but I got it up and running in one weekend and was able to move onto the next, and more exciting part of the project.
After confirming that I could read and write to my registers using the jupyter notebook interface, it was time to hookup the detector to the pynq board!

I used the special ADC inputs labeled V_P and V_N on the pynq board because the rest of the ADC channels have some external circuitry wired up to them that I didn't really want to deal with, though it probably would be possible to use them if I really needed to.
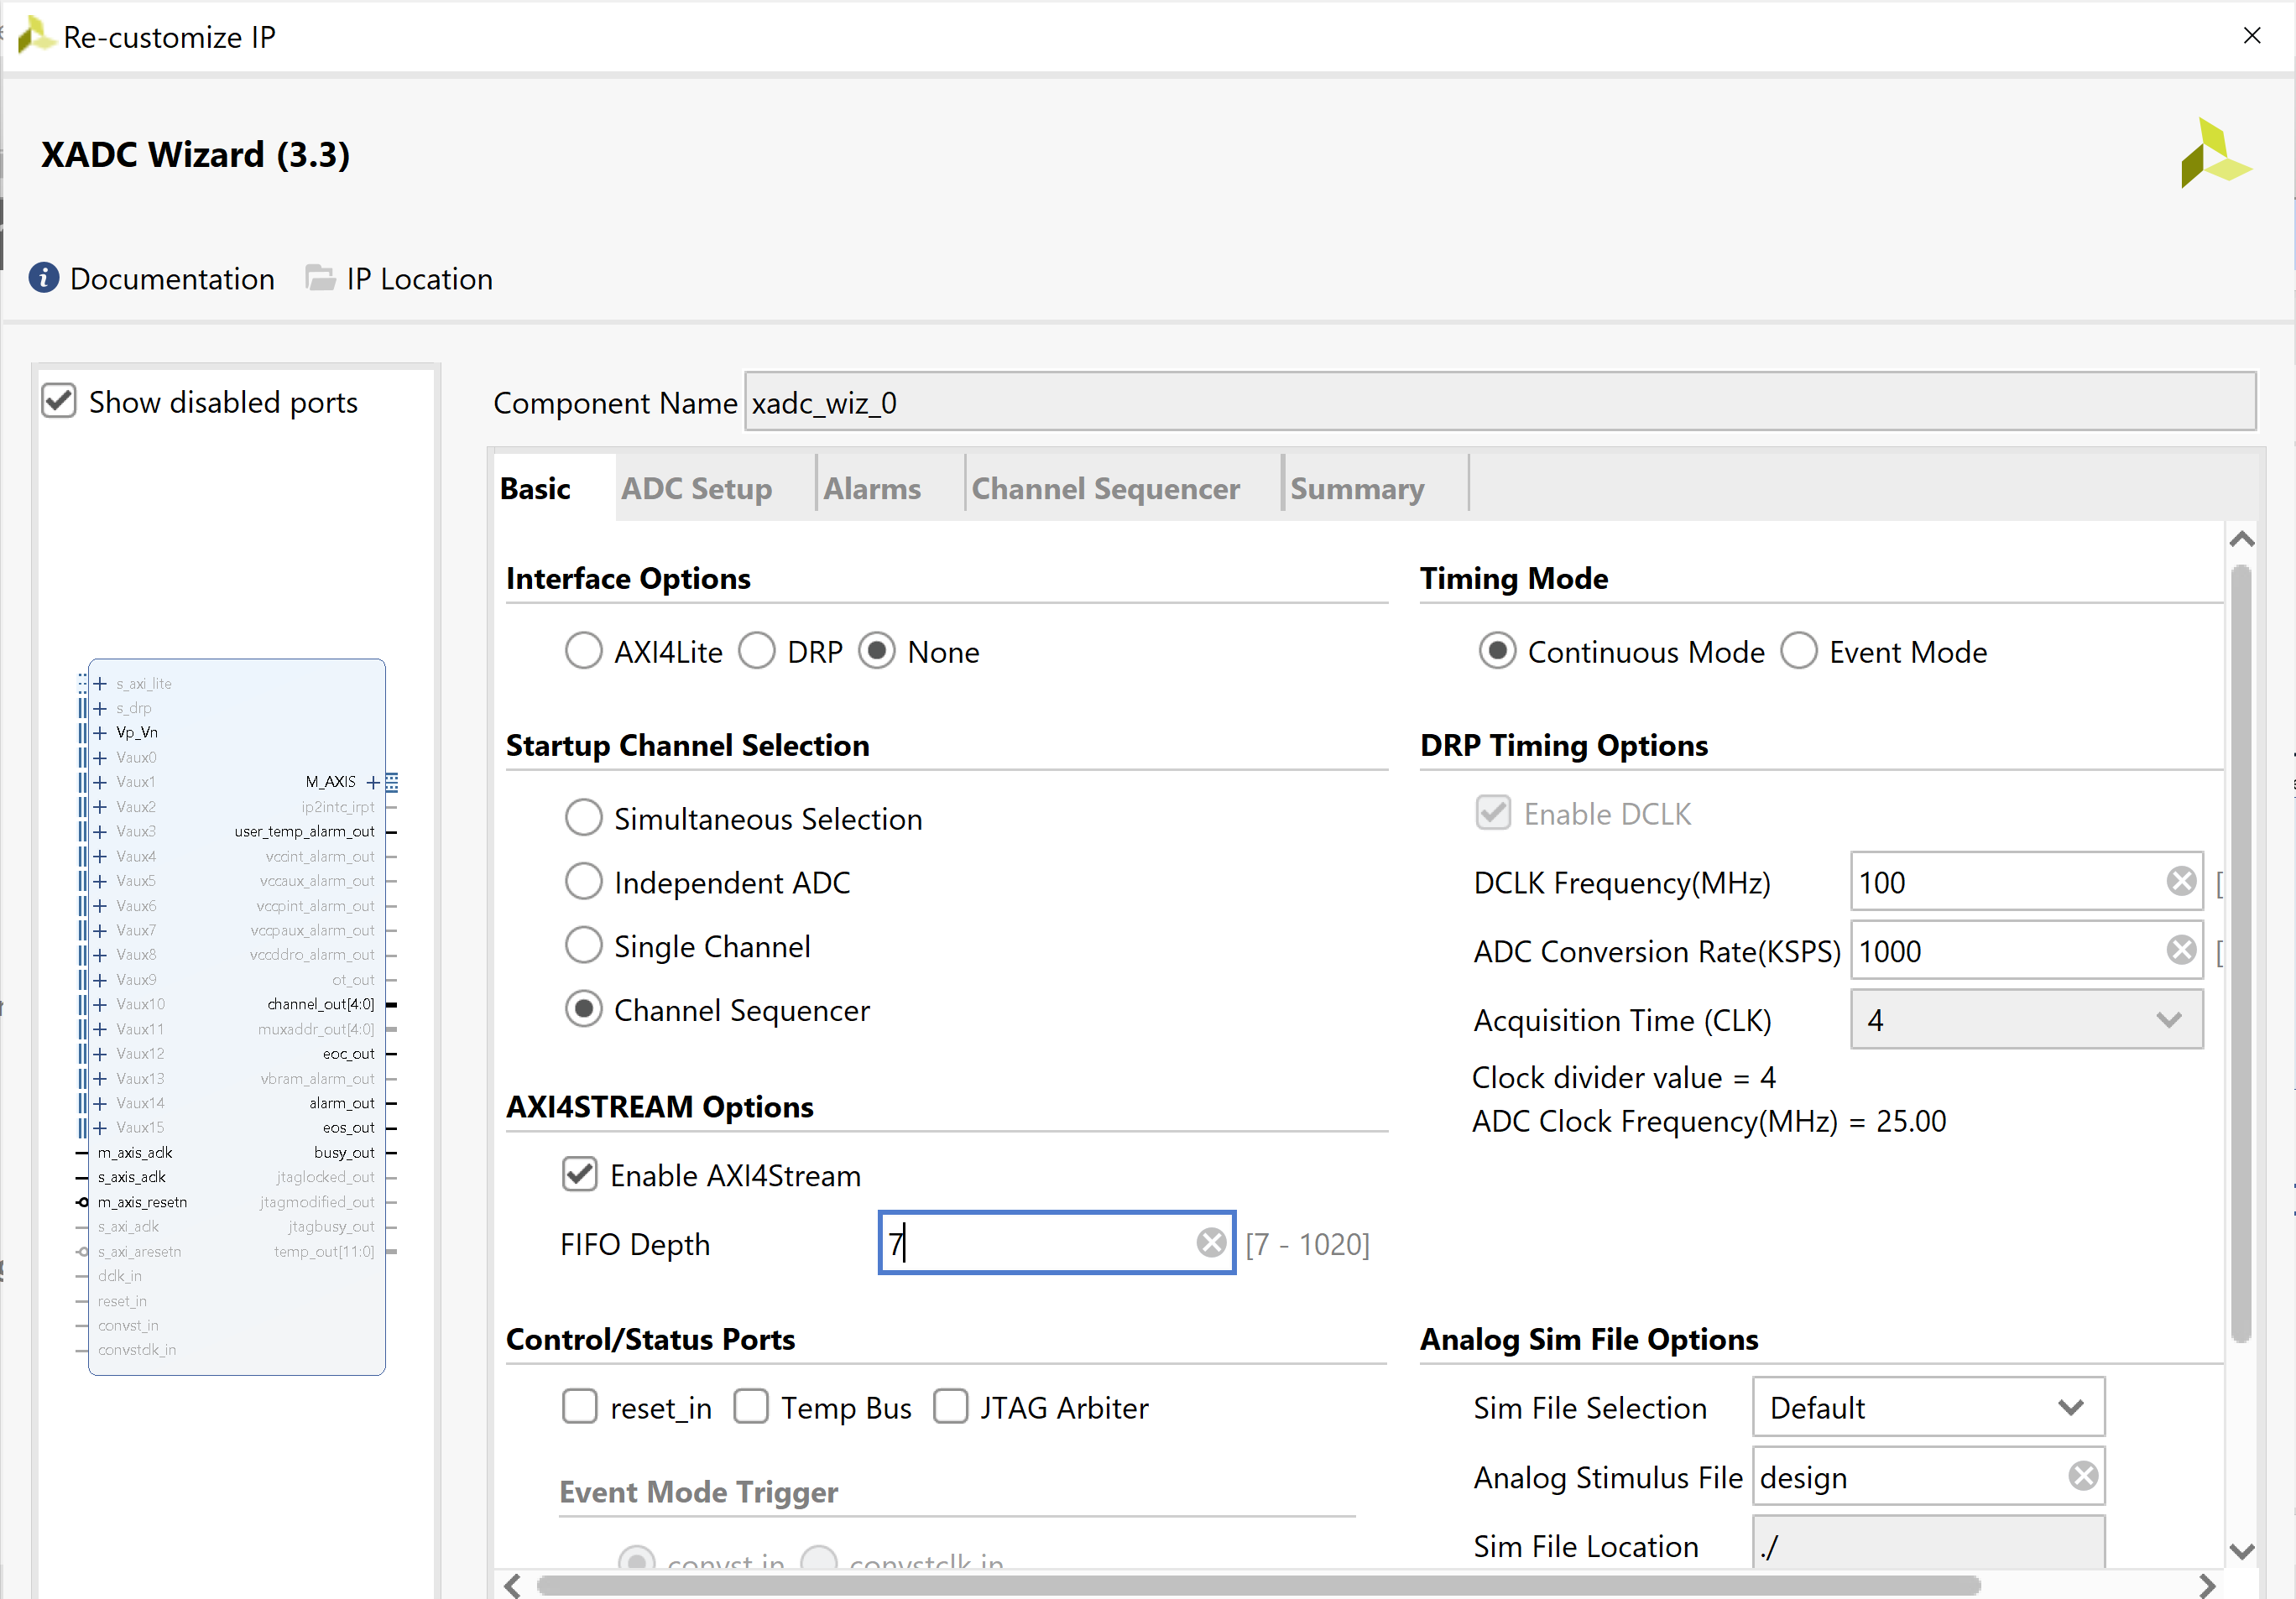
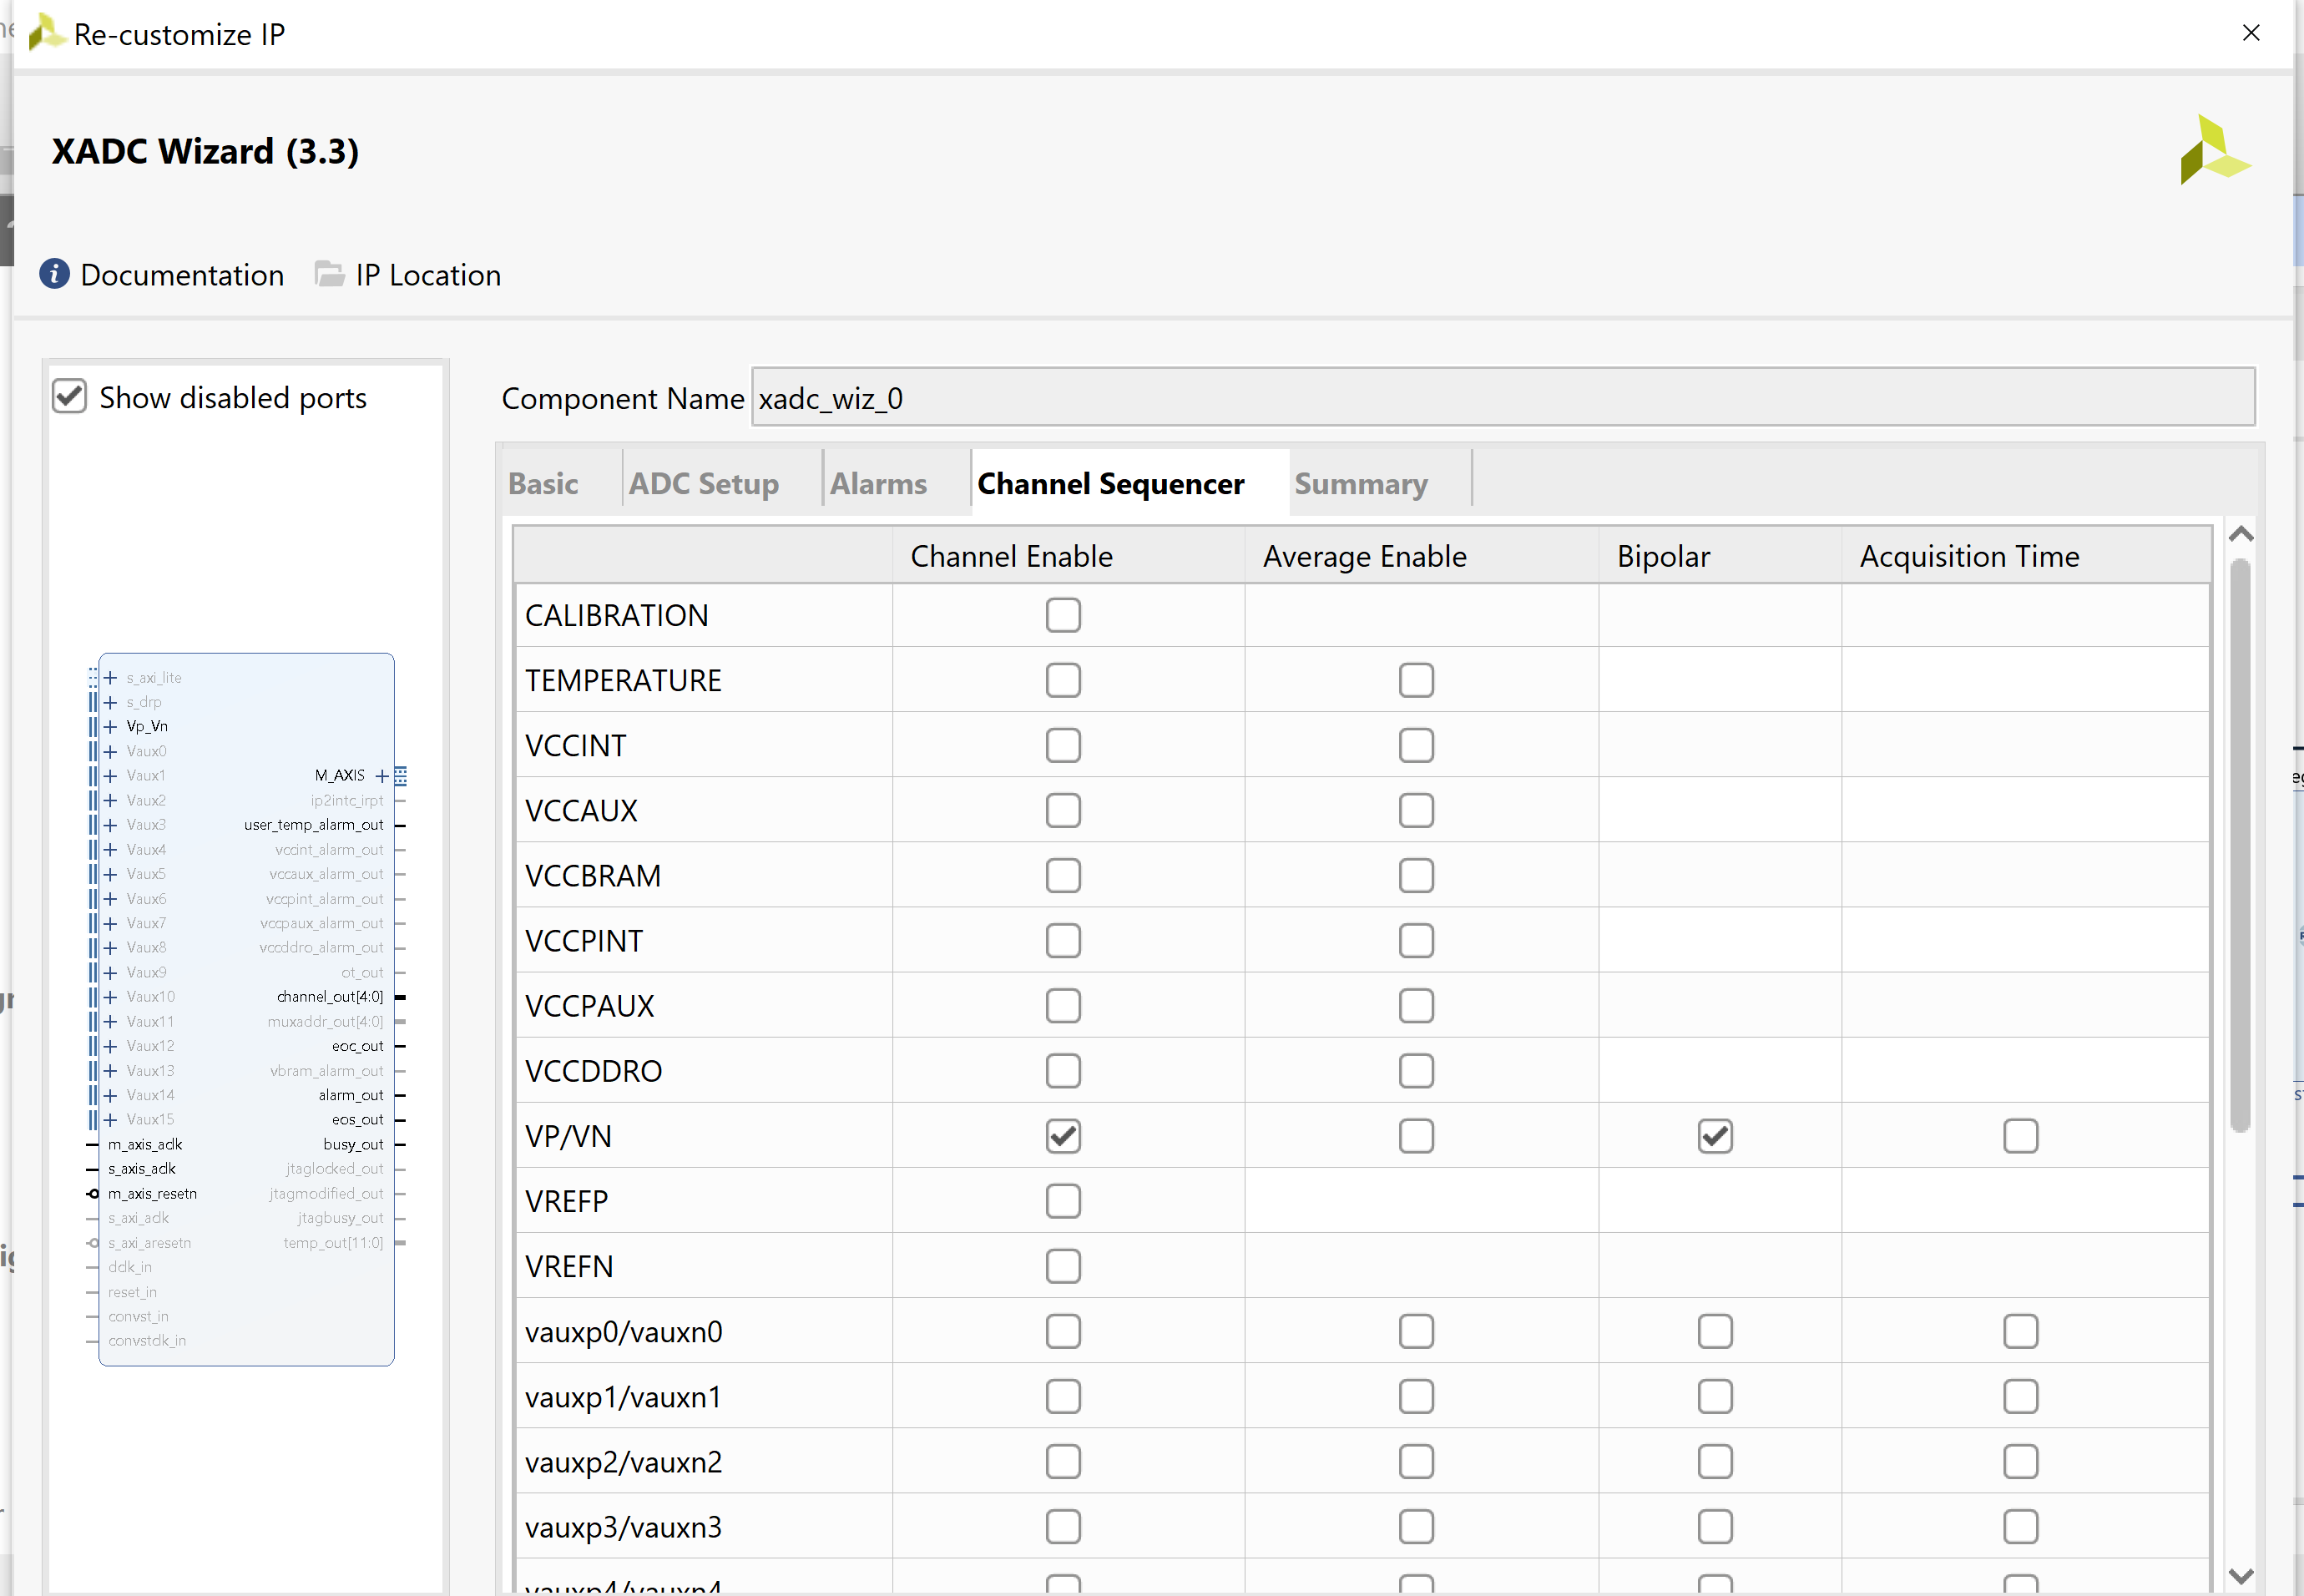
Getting the XADC wizard to work ended up being a bigger headache than I expected, I didn't care about reconfiguring the ADC during operation, so I didn't synthesize the AXI4Lite or DRP port. For whatever reason, I was never able to get the AXI4-stream port to output any data in single channel mode, so I enabled the channel sequencer but only selected the one channel I wanted in the channel sequencer tab. Not sure if that is a bug in Vivado 2021.1 (I really need to upgrade Vivado...) that has been fixed in newer versions, or if there is some other mistake I was making. Regardless, data started streaming immediately as soon as I switched from the single channel to channel sequencer.
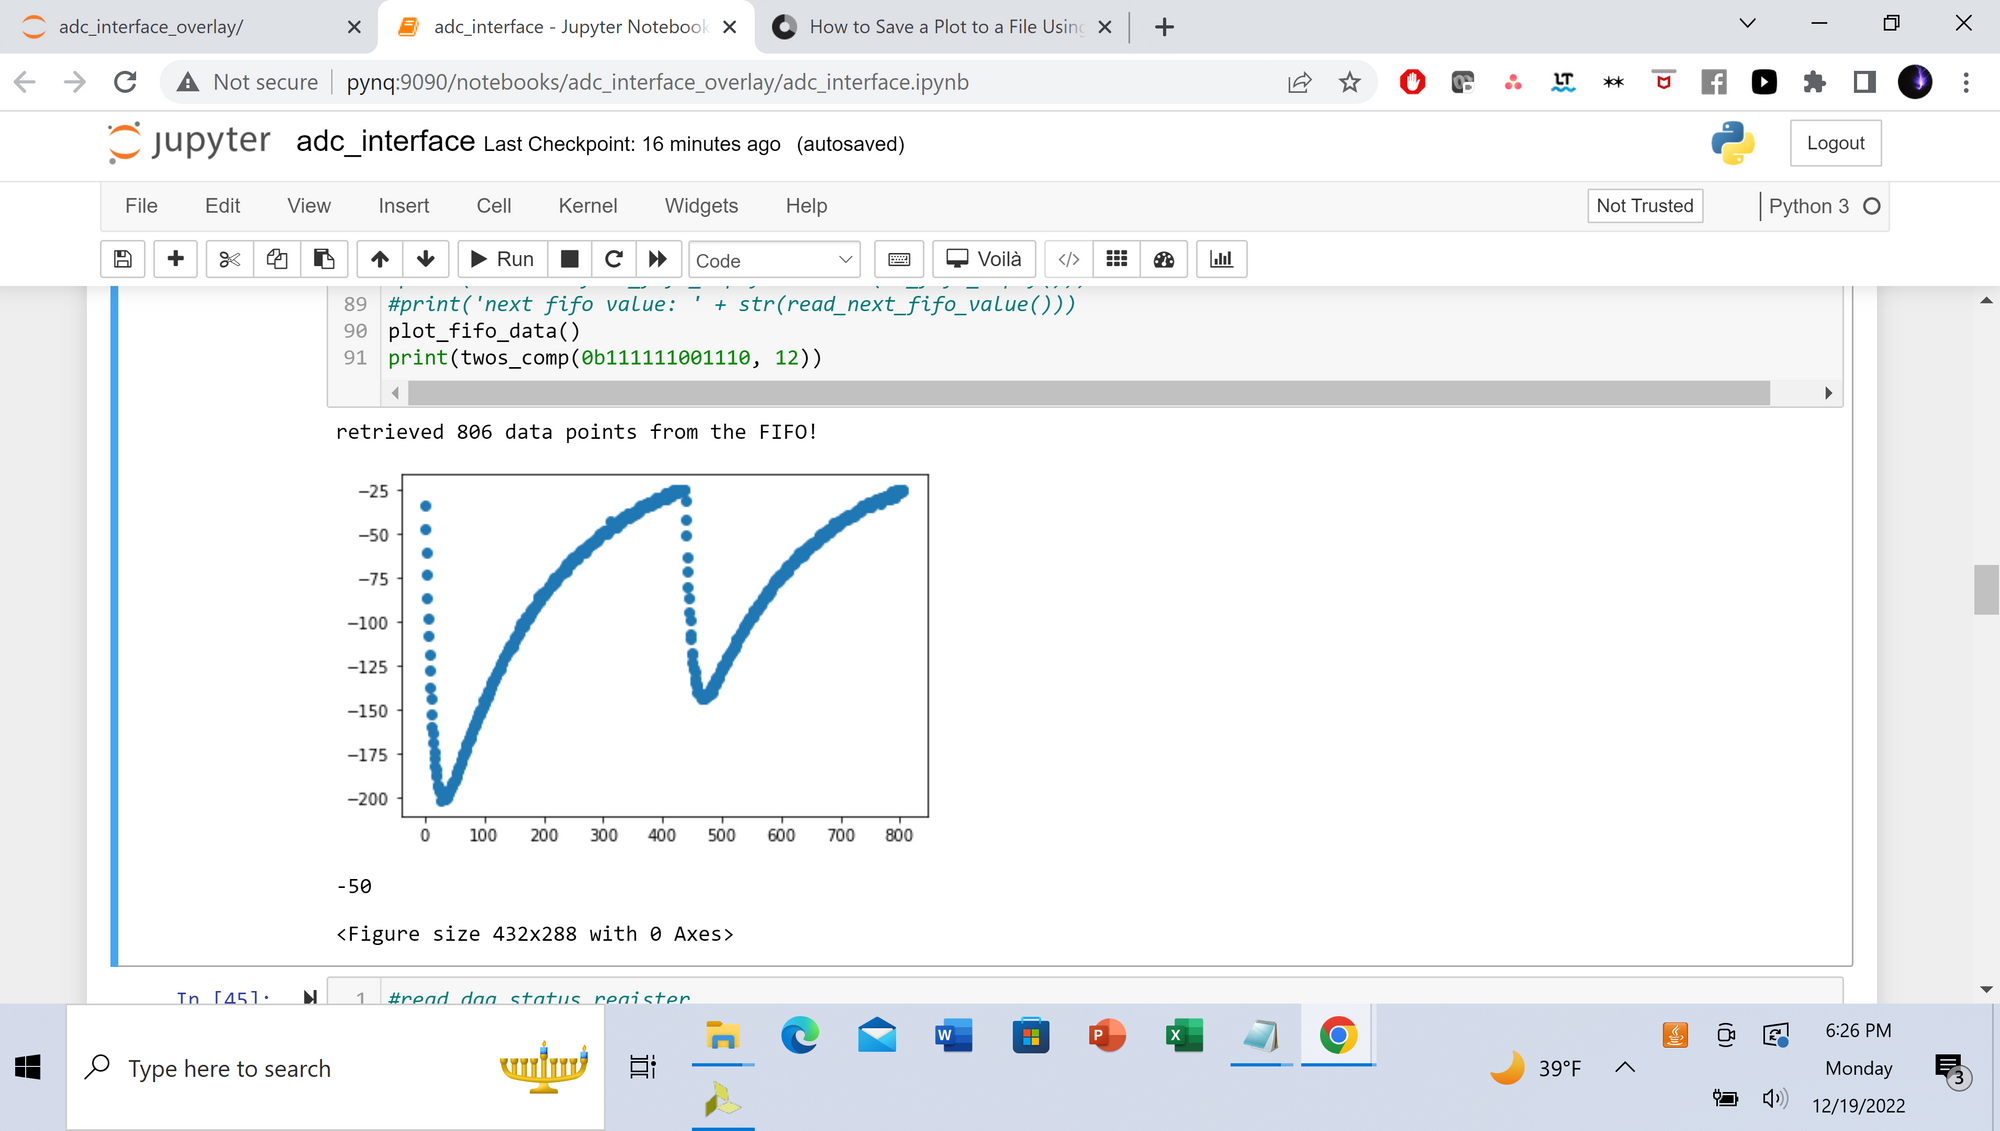
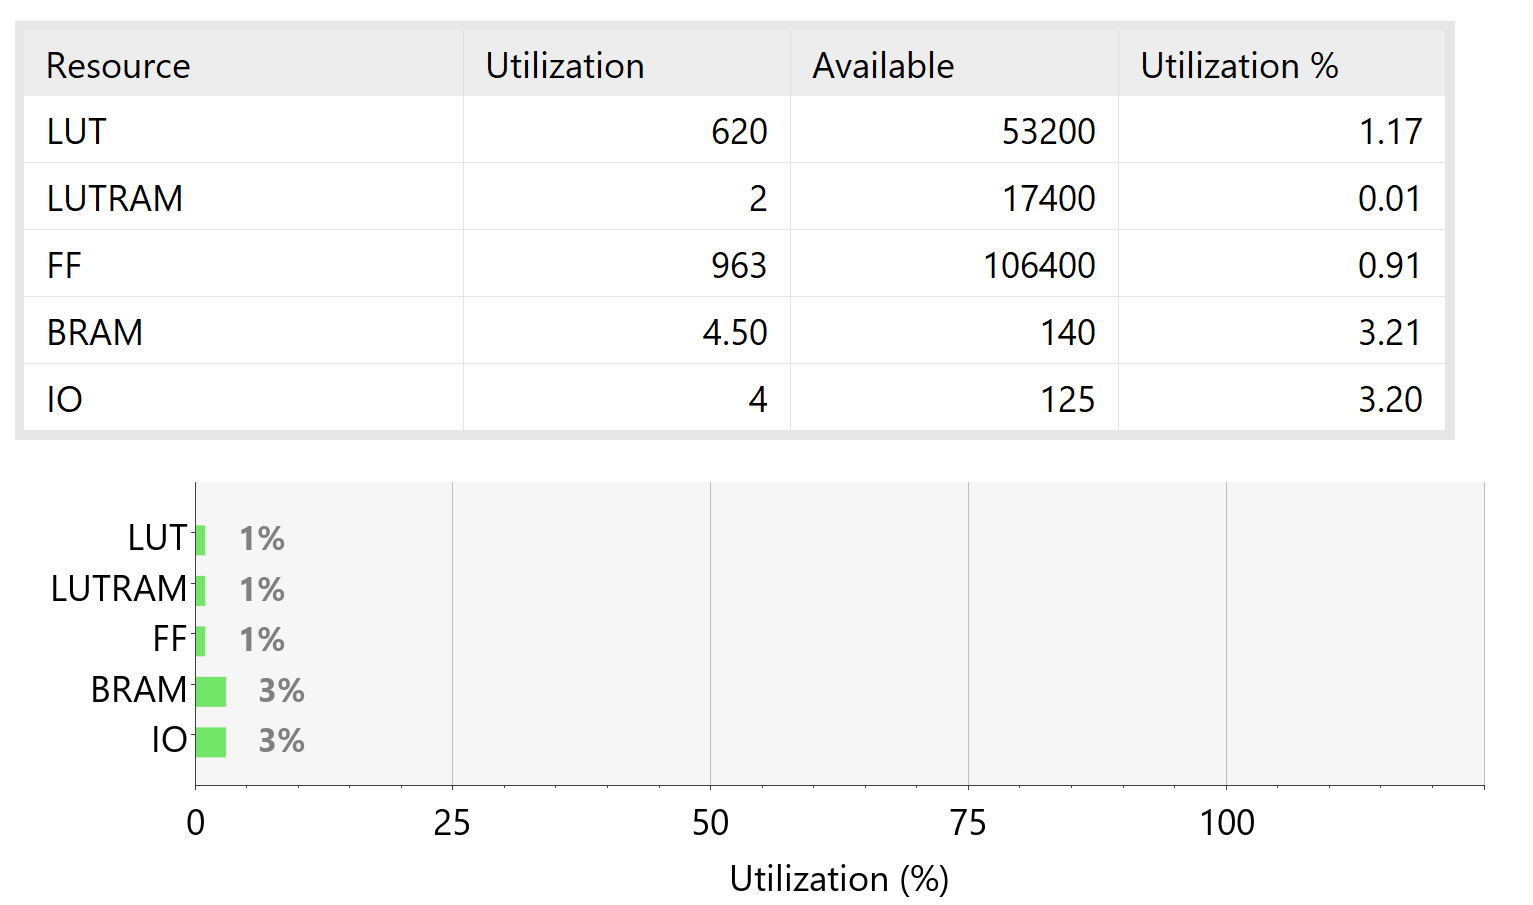
At this point, the block design for my over lay looks like this:
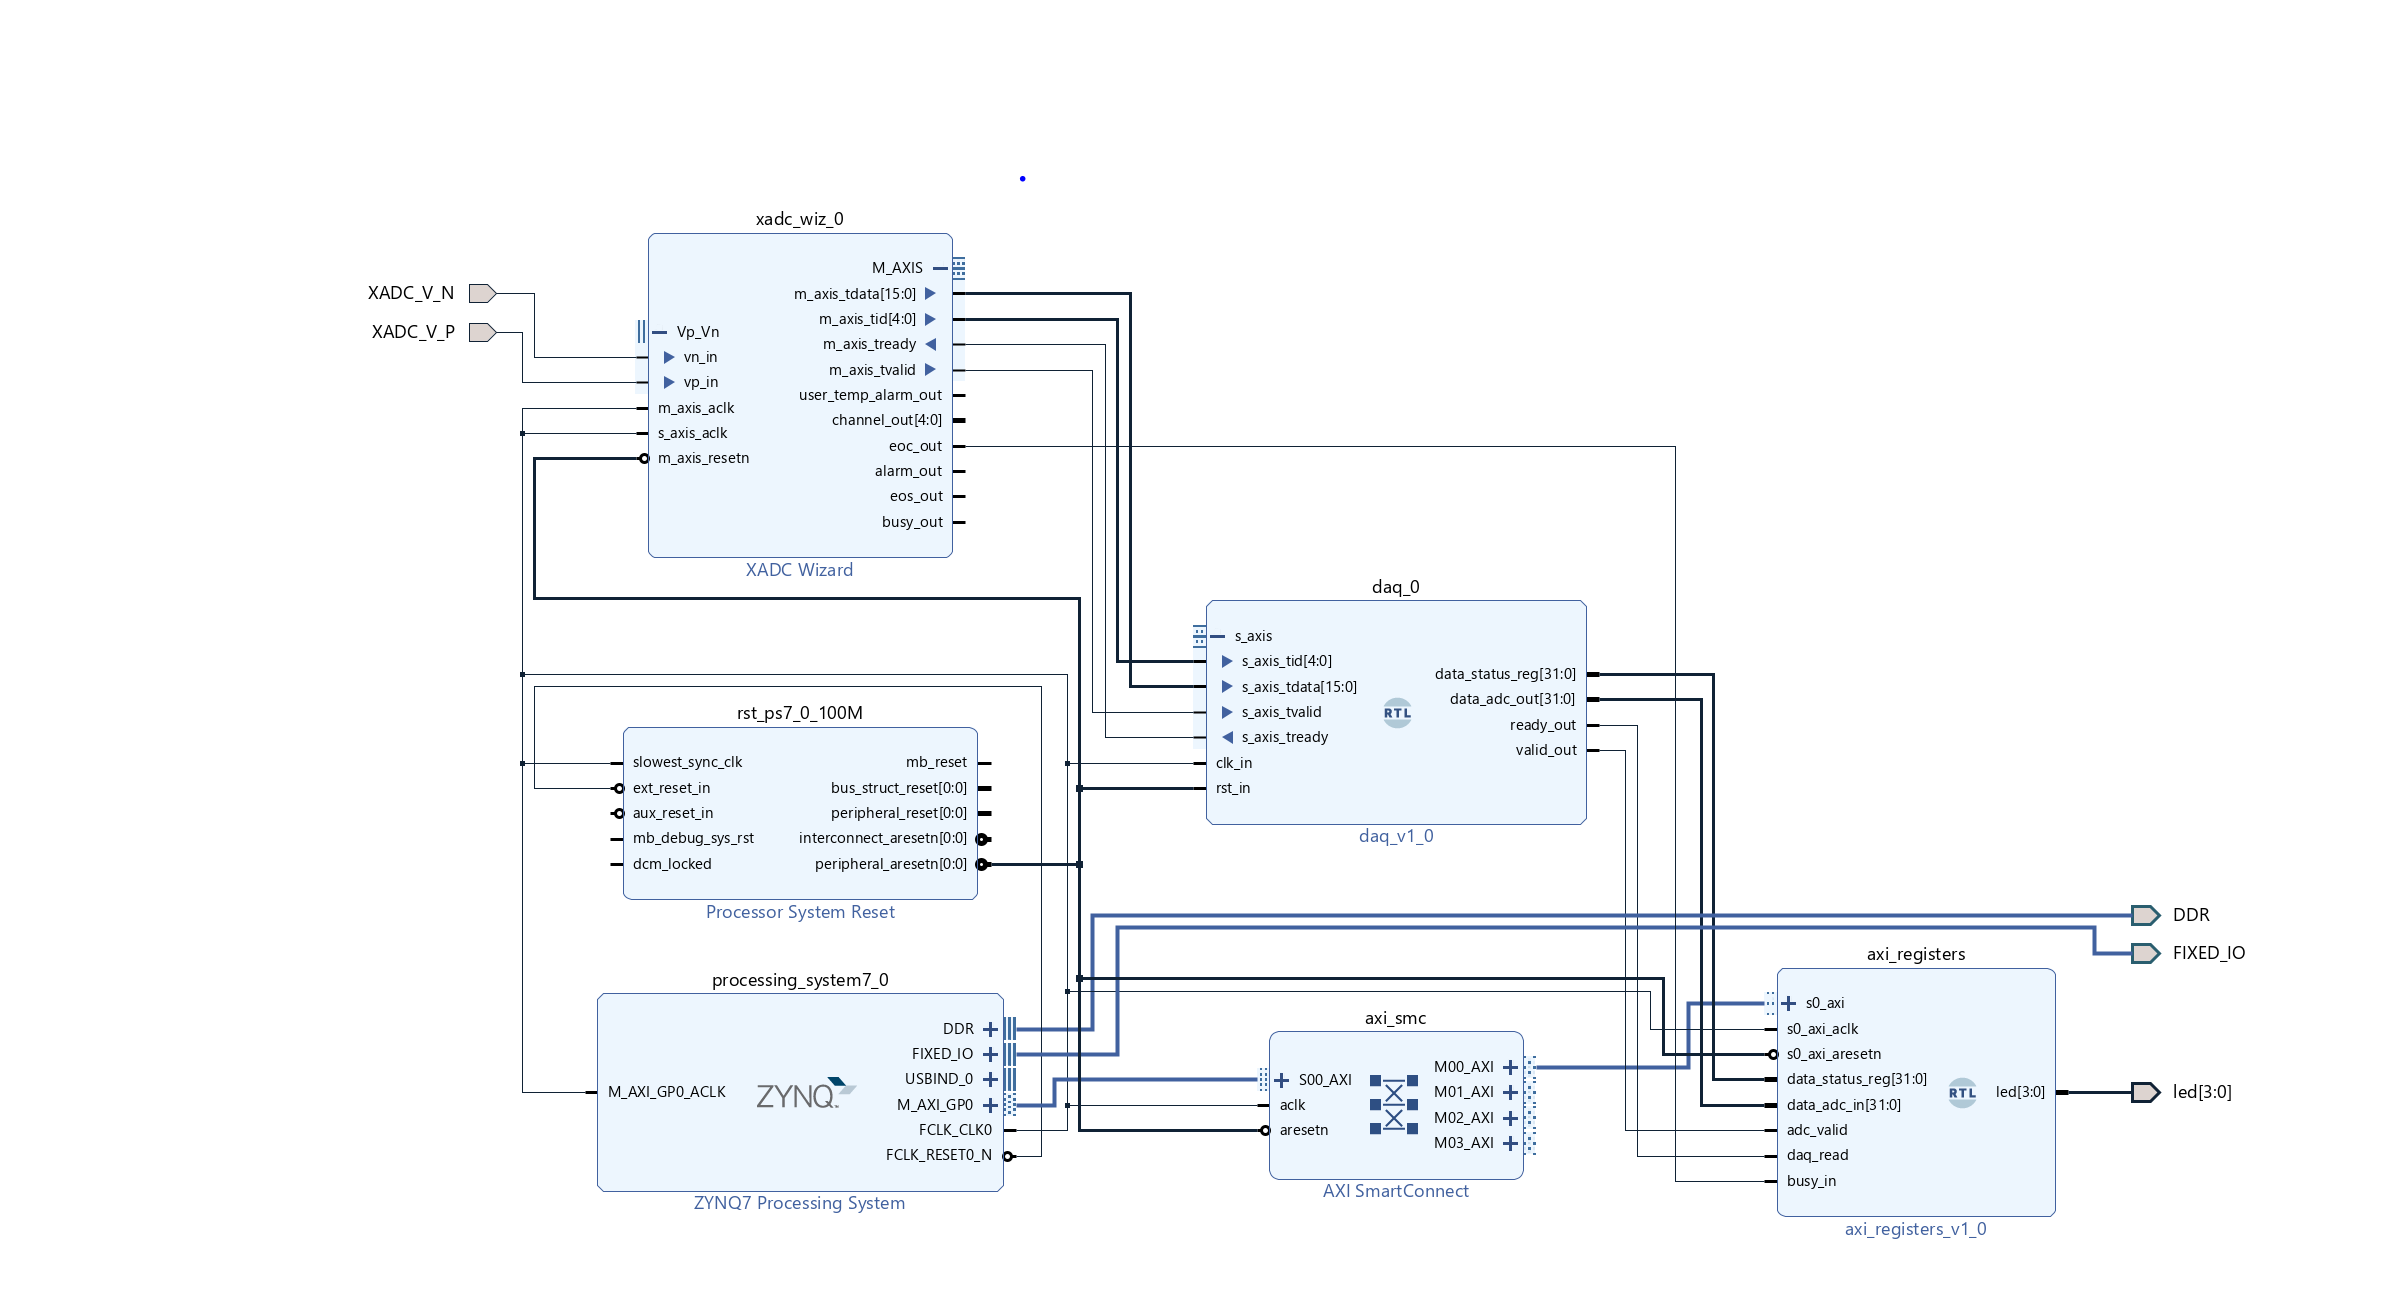
I created a daq.v to read data from the axi-stream interface coming from the ADC. I wired the output data to a register in the axi_registers module, and read the registers from the jupyter notebook. I was able to read the values just fine, and the detector was producing way less noise than I was expecting, especially considering my sloppy breadboard connection.
I placed an Am-241 source on the detector and plotted a snippet from the data stream in the jupyter notebook, and was able to read-out my first alpha pulse on the pynq board!
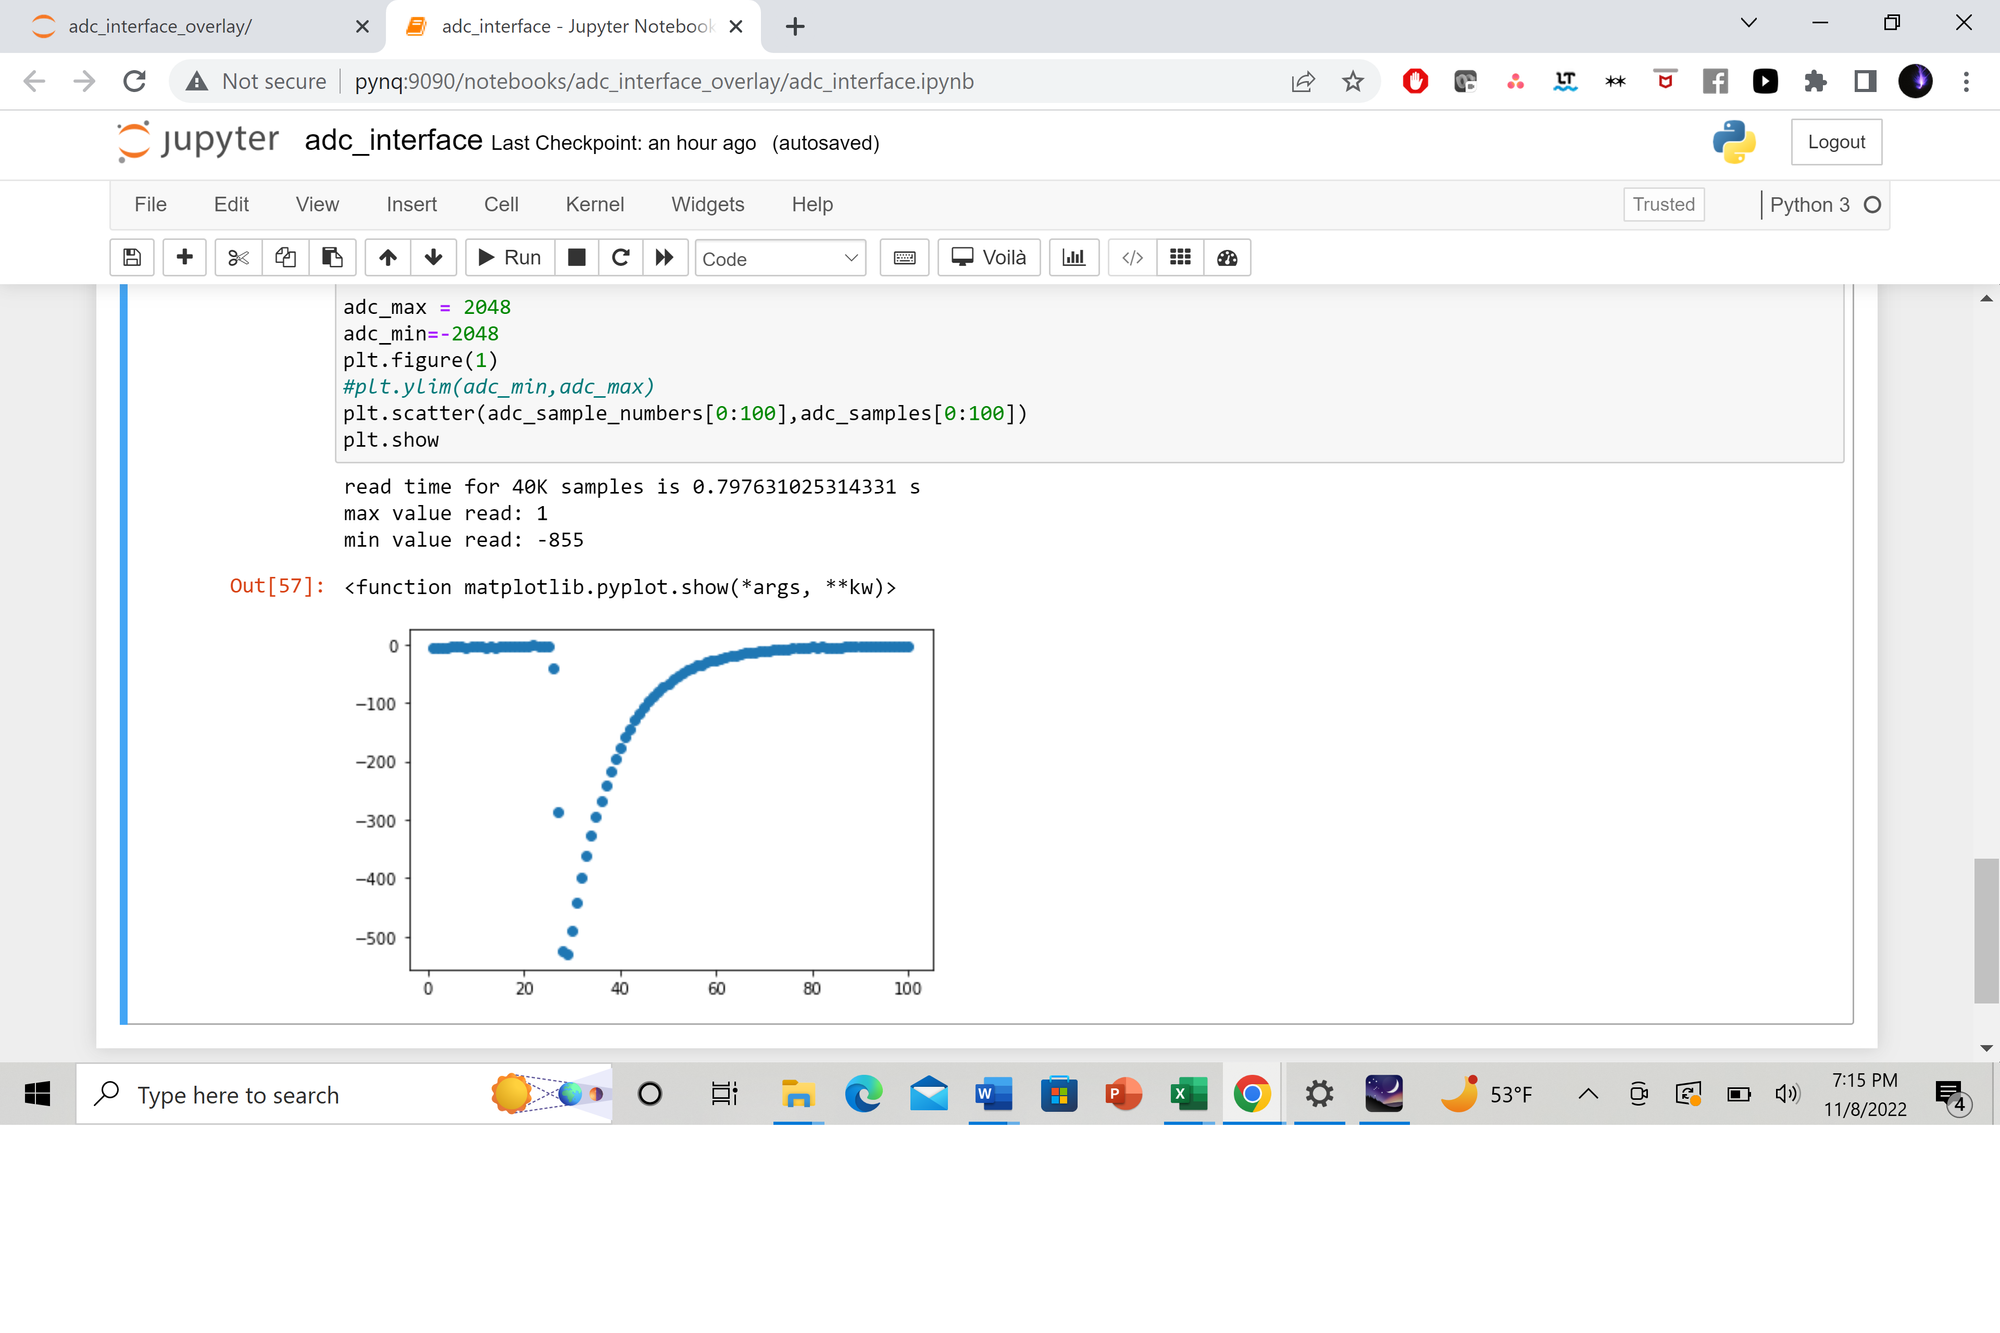
It's worth noting the ADC module presents negative voltages using twos-compliment, which takes some conversion for python to deal with properly since a 12-bit value is not a standard datatype.
Level Thresholding and Counting Pulses
I took about a month long break on this project after getting the ADC working, but finally got around to adding some more bells and whistles because I got sick and couldn't really go out and do much else.
I started by implementing the ADC level-threshold in the FPGA fabric to allow the DAQ to actually trigger on pulses rather than simply forward a data stream from the ADC to the procesor. The threshold value is written by the processor using a DAQ control register. In this way, the DAQ functions a lot like a peripheral module in a microcontroller where the processor can control its behavior by writing control registers and retrieve data by reading status and data registers. If you're interested, I've documented what all the bits in the control and status registers do in comment blocks that can be found in both the jupyter notebook and the verilog in the github repo linked at the very top of this post.
Because the ADC can read both positive and negative pulses, the threshold gets a little bit more complicated since it could be a threshold on both how negative the pulse gets (i.e. the ADC value must be less than the threshold value to register as a valid pulse) or how positive the the puse gets (i.e. the ADC value must be greater than the threshold value to register as a valid pulse), so the control register includes an extra bit to control what I call the "threshold direction."
With the detector here, we only ever expect to see negative pulses, so the ADC value will always need to be less than the threshold value to trigger the DAQ, but I figured I might as well make that configureable in case I try to use a different detector with the same system in the future.
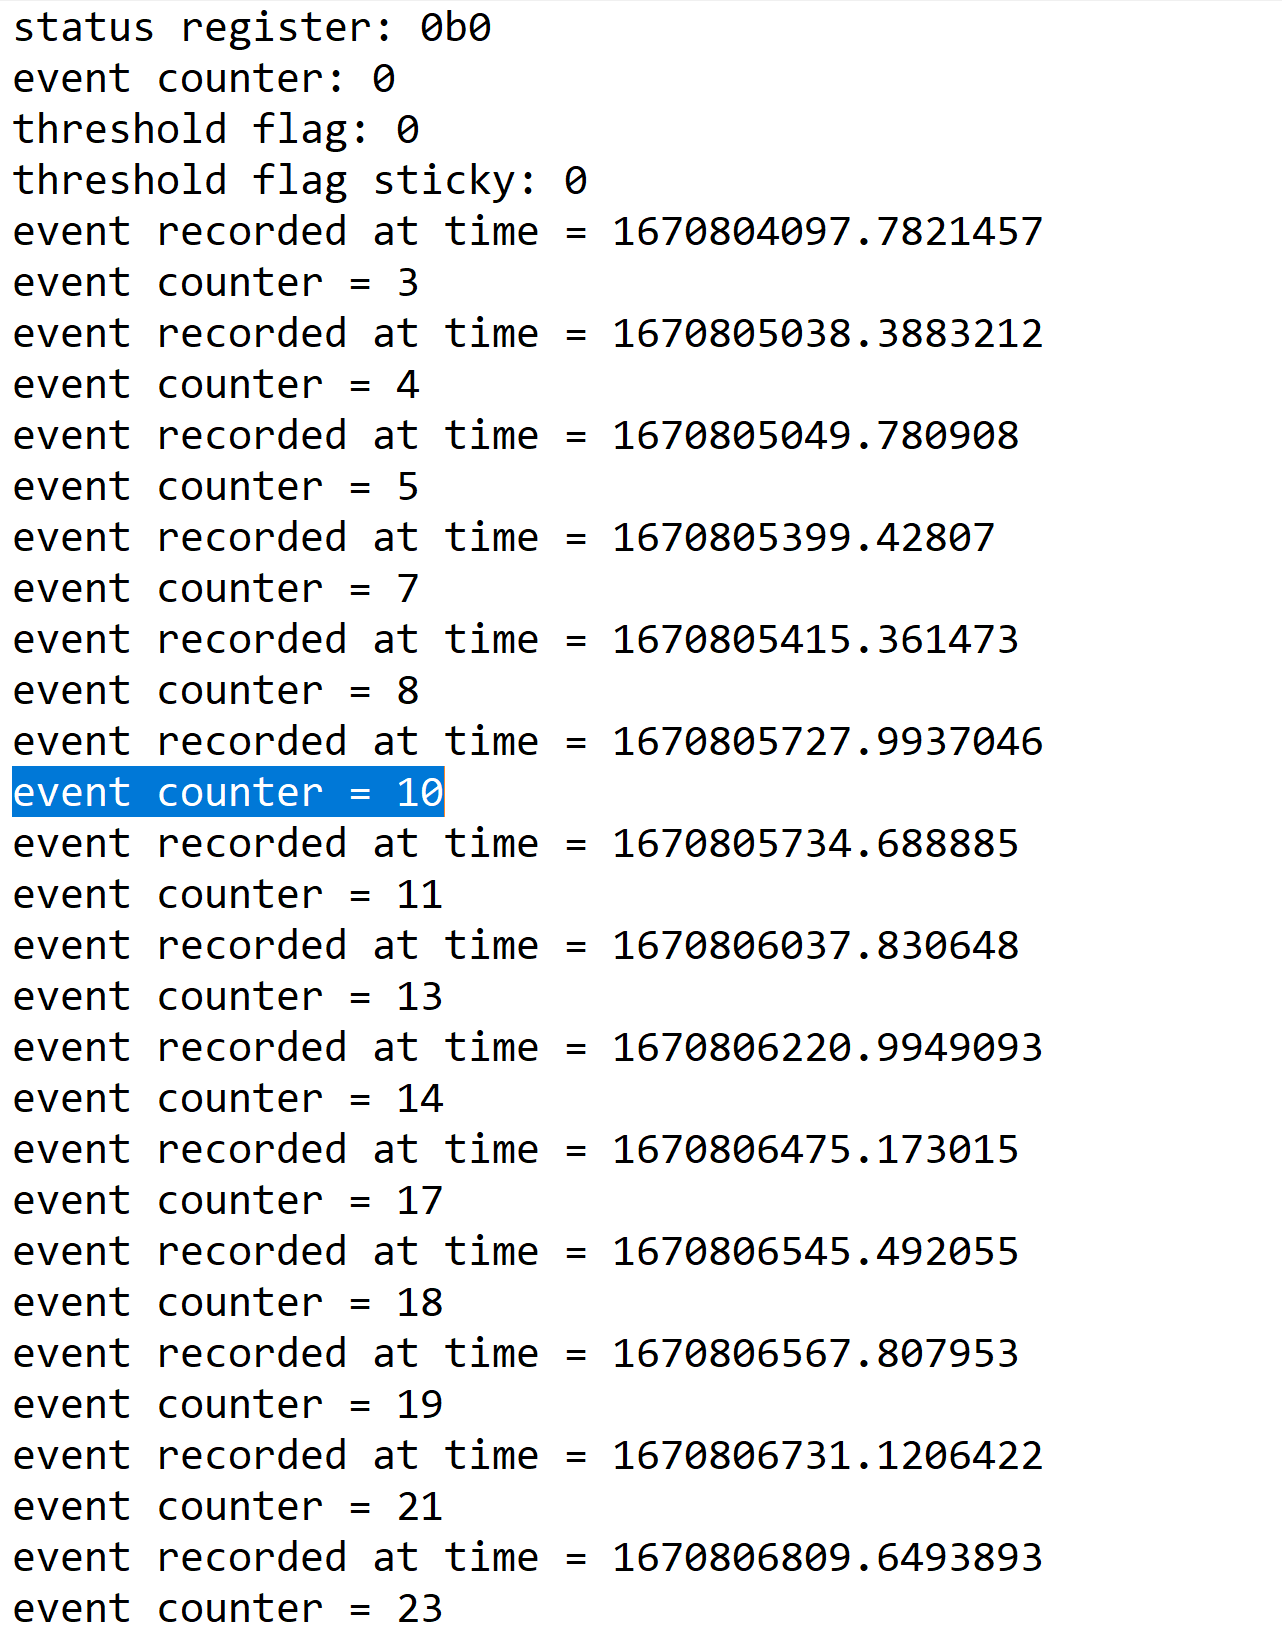
I added some logic to the DAQ to set a threshold flag bit everytime the ADC triggers the DAQ and increment an event counter. I also added a "sticky" threshold flag bit which gets set if the DAQ is triggered, but won't clear until its explicitly reset by the processor via the DAQ control register. These sorts of sticky bits are nice when you know the processor is going to be processing data significantly slower tha the PL, which is certainly the case here given how painfully slow the Python runs.
With all that out of the way, I wrote a quick python script to continuously check the sticky threshold flag from the DAQ, increment an event counter, and clear the sticky bit. The event counter in the Python could then be compared to the event counter in the PL.
In theory, this was all I needed to do some basic counting experiments, so I tried measuring the Radon background again using the new DAQ system. I noticed right away the event counter in the PL often incremented multiple times for each event read in the python via the sticky bit. Given how low the count rate is, it's unlikely that I was really registering multiple counts in the time it took the python to read and clear the sticky bit, so this indicated some sort of interference from noise.
This meant that I was probably going to have to take a closer look at the pulse data to figure out how exactly noise was interfering with the measurements. I couldn't simply read the ADC values from the Python as soon as it saw the sticky threshold bit was set, because the Python runs way too slow. By the time it sees there was an event, it has already passed. So, I started implementing a data FIFO to buffer all ADC values that triggered the DAQ. Once buffered, the processor could read back values from the FIFO at a liesurely pace without fear of missing anything.
Implementing ADC Data FIFO
Xilinx offers plently of FIFO IPs that I could probably have just dropped into my design. In fact, the XADC Wizard IP already has a FIFO built into the Axi-stream interface, but I wasn't sure if I could make it deep enough for my purposes. Besides, I figured it would be a good learning experience to implement my own FIFO from scratch.
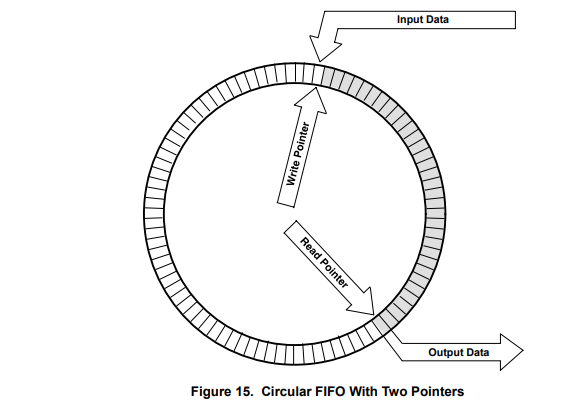
FIFO's really don't have a whole lot going on. They're just a memory with a write and read pointer indicating which address should be read or written into the memory. Most FIFOs additionally include an empty and full signal to indicate when the read pointer has caught up to the write pointer and vice versa.
I was familiar with the basic concepts of a FIFO described above, but some of the details were a bit fuzzy, so I consulted a pretty detailed TI app note that explained a lot of different FIFO architectures. I ended up implementing the "Circular FIFO" using a simple dual-port BRAM that was 32 bits wide and 4096 addresses deep in a verilog file named FIFO.v.
The implementation was pretty straightforward at first. Data is read and written into the fifo module via an axi-stream-like interface that uses a ready-valid handshake. Write operations into the BRAM are pretty trivial since they have a 1 clock cycle latency, but the read operations required a simple state machine to ensure an appropriate delay following the incrementing of the read pointer since the BRAM has a 2 clock cycle read latency. Obviously, after each read or write operation the respective pointer is simply incremented and will automatically wrap back around once it increments past the final address.
The only snag I really ran into was implementing the empty and full signals. You can't write to the FIFO if it's full, and likewise, you can't read from it if it's empty, so these signals are pretty important to get right. In principle they're simple. If the read pointer catches up to the write pointer, the FIFO is empty. If the write pointer catches up to the read pointer, the FIFO is full. I had been trying to implement some combinatorial logic to assign the empty full signals based on the write/read pointers and their previous values, but couldn't quite get it to work on the edge case where the pointers catch up to each other on address zero. I was about to break down and write a state machine to do the job, but I had a feeling someone smarter than me had already found a better solution.
Finally, I simply googled the problem. Within about 10 seconds, I found an incredibly clever and elegant solution. All you have to do is add an extra MSB to the write and read pointers (in this case using 13 instead of 12 bits for each pointer). You still use the LSBs (the lower 12 bits, in this case) for the actual address values connected to the BRAM, but the MSB will toggle each time the pointer rolls-over. Thus, if the the full 13 bits of both pointers were equal, the FIFO is empty (i.e. the read pointer has caught up to the write pointer), but if the 12 bit address values are equal, but the MSBs aren't, the write pointer must have rolled over one more time than the read pointer, indicating that the FIFO is full (i.e. the write pointer has caught up to the read pointer). Using this method, the combinational logic to assign the and empty and full signals is dead simple, and only requires the addition of two more flip-flops as opposed to the approach I was trying to take that doubled the number of flip-flops to keep track of the previous pointer values.
I wish I could have thought of that solution myself, but the path I was trying to take was simply in such a completely different direction that I don't think it would have ever occurred to me. I guess that just goes to show how important it is to approach problems from multiple angles and expose yourself to as many ideas from as many people as possible.
With the empty and full signals worked out, I confirmed my fifo module was working with a test bench and then wired it into the DAQ. I added an extra axi register to hold the FIFO data, and added a few more bits to the DAQ control register to control the FIFO.
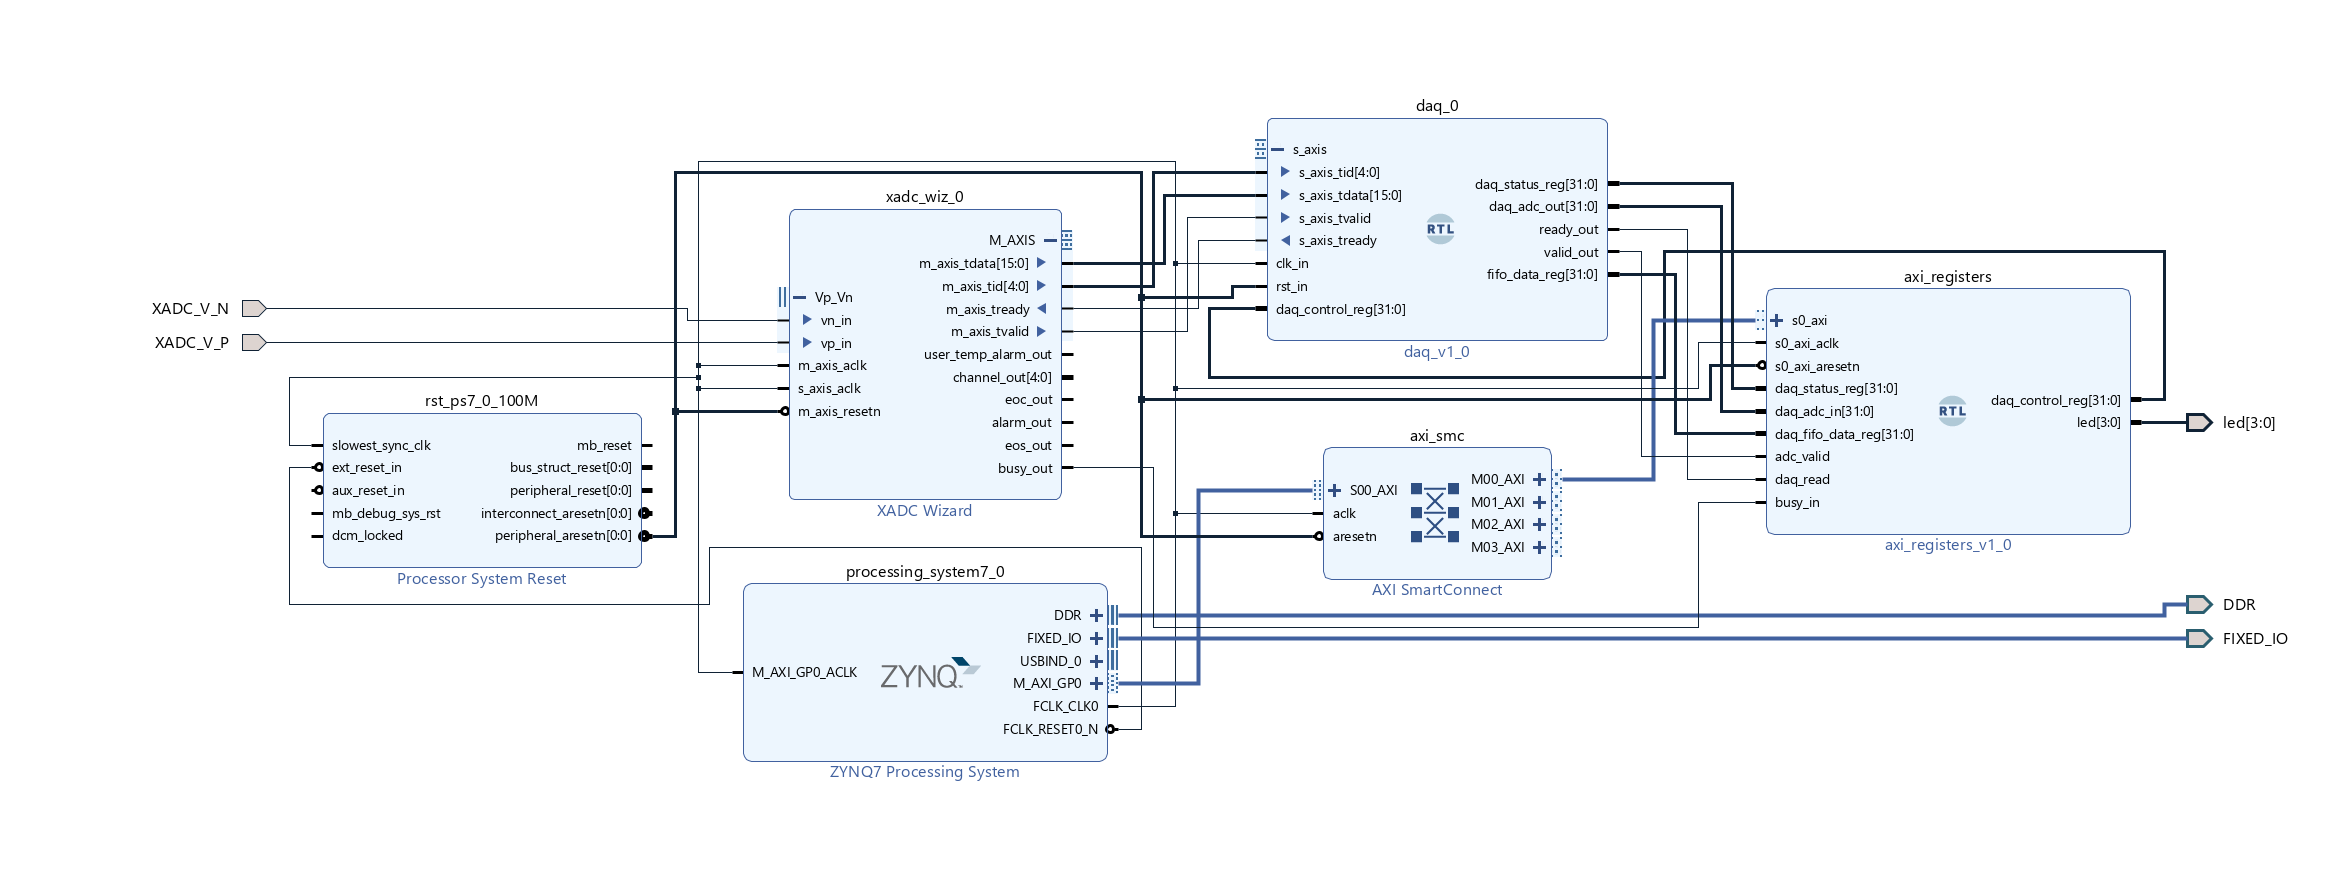
The real pain in the neck with getting the processor to read the FIFO comes down to how much slower the Python runs compared to the PL. Ready-valid handshakes aren't going to cut it since in the time it takes the Python to assert and deassert a ready signal to read a single value, the PL would happily drain the entire FIFO. Therefore, I had to implement a special state machine in the PL to perform a slightly more complex handshake involving a data request and multiple acknowledgements.
Once I got all the Verilog worked out to allow the DAQ to write ADC data into the FIFO when it was triggered and allow the processor to read data from the non-empty FIFO via the axi registers, it was time to write some python to give it all a test.
I started by writing a function to reset the fifo module called reset_daq_fifo(). This primarily resets the read and write pointers so that the FIFO goes back to being empty and any existing data will be overwritten.
Next I wrote a simple function to check if the FIFO was empty called is_fifo_empty(). The empty and full signals were included in the DAQ status register, so this simply involved reading a bit from a register.
I got that working pretty quick, so I then wrote a function to perform the fifo-read handshake and read out the next value called read_next_fifo_value(). This was honestly the most complicated function, but really just consisted of a simple sequence of a few register reads and writes. I tried reading a few values from the FIFO, and everything looked about right.
Building on that slightly, I wrote a function called drain_fifo() that continually reads the next value from the FIFO until the empty signal is asserted. This function returns a list of the ADC values read out from the FIFO. I waited for a pulse to fill the FIFO with some data, ran the function, and printed the values. The values definitely looked like a pulse, so I was starting to get excited.
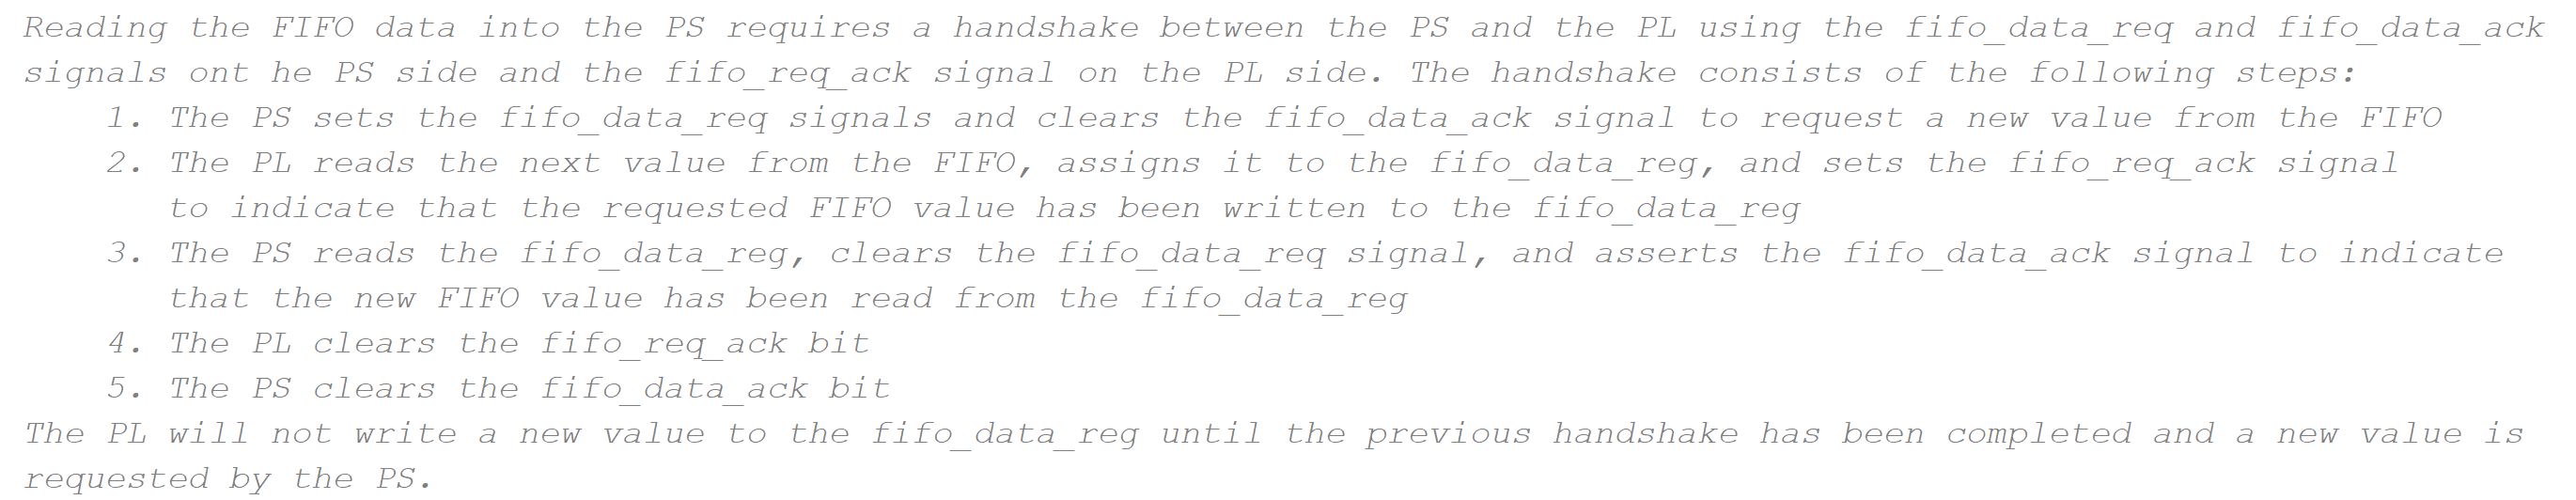
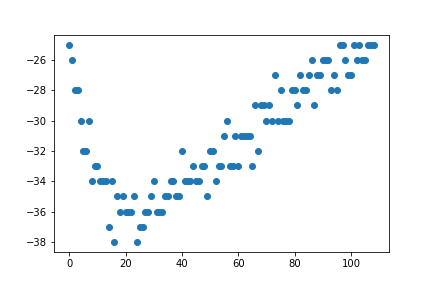
I augmented the drain_fifo() function a bit with a plot_fifo_data() function that still drained the FIFO and returned a list of values, but also generated a nice scatter plot of the data. I ran the function I was greeted by the following plot.
The pulse was relatively small, so some noise was evident, but it was clear that far more samples were captured using the FIFO than previously when the python was just reading the data stream as fast as it could. Furthermore, I could be confident that all data from an event that triggered the FIFO was actually getting recorded.
Even though this was all fairly simple code, I could feel a sort of adrenaline rush washing over me as it all came together, which is sadly not something I'd felt while coding in quite a long time. It was good to feel that again.
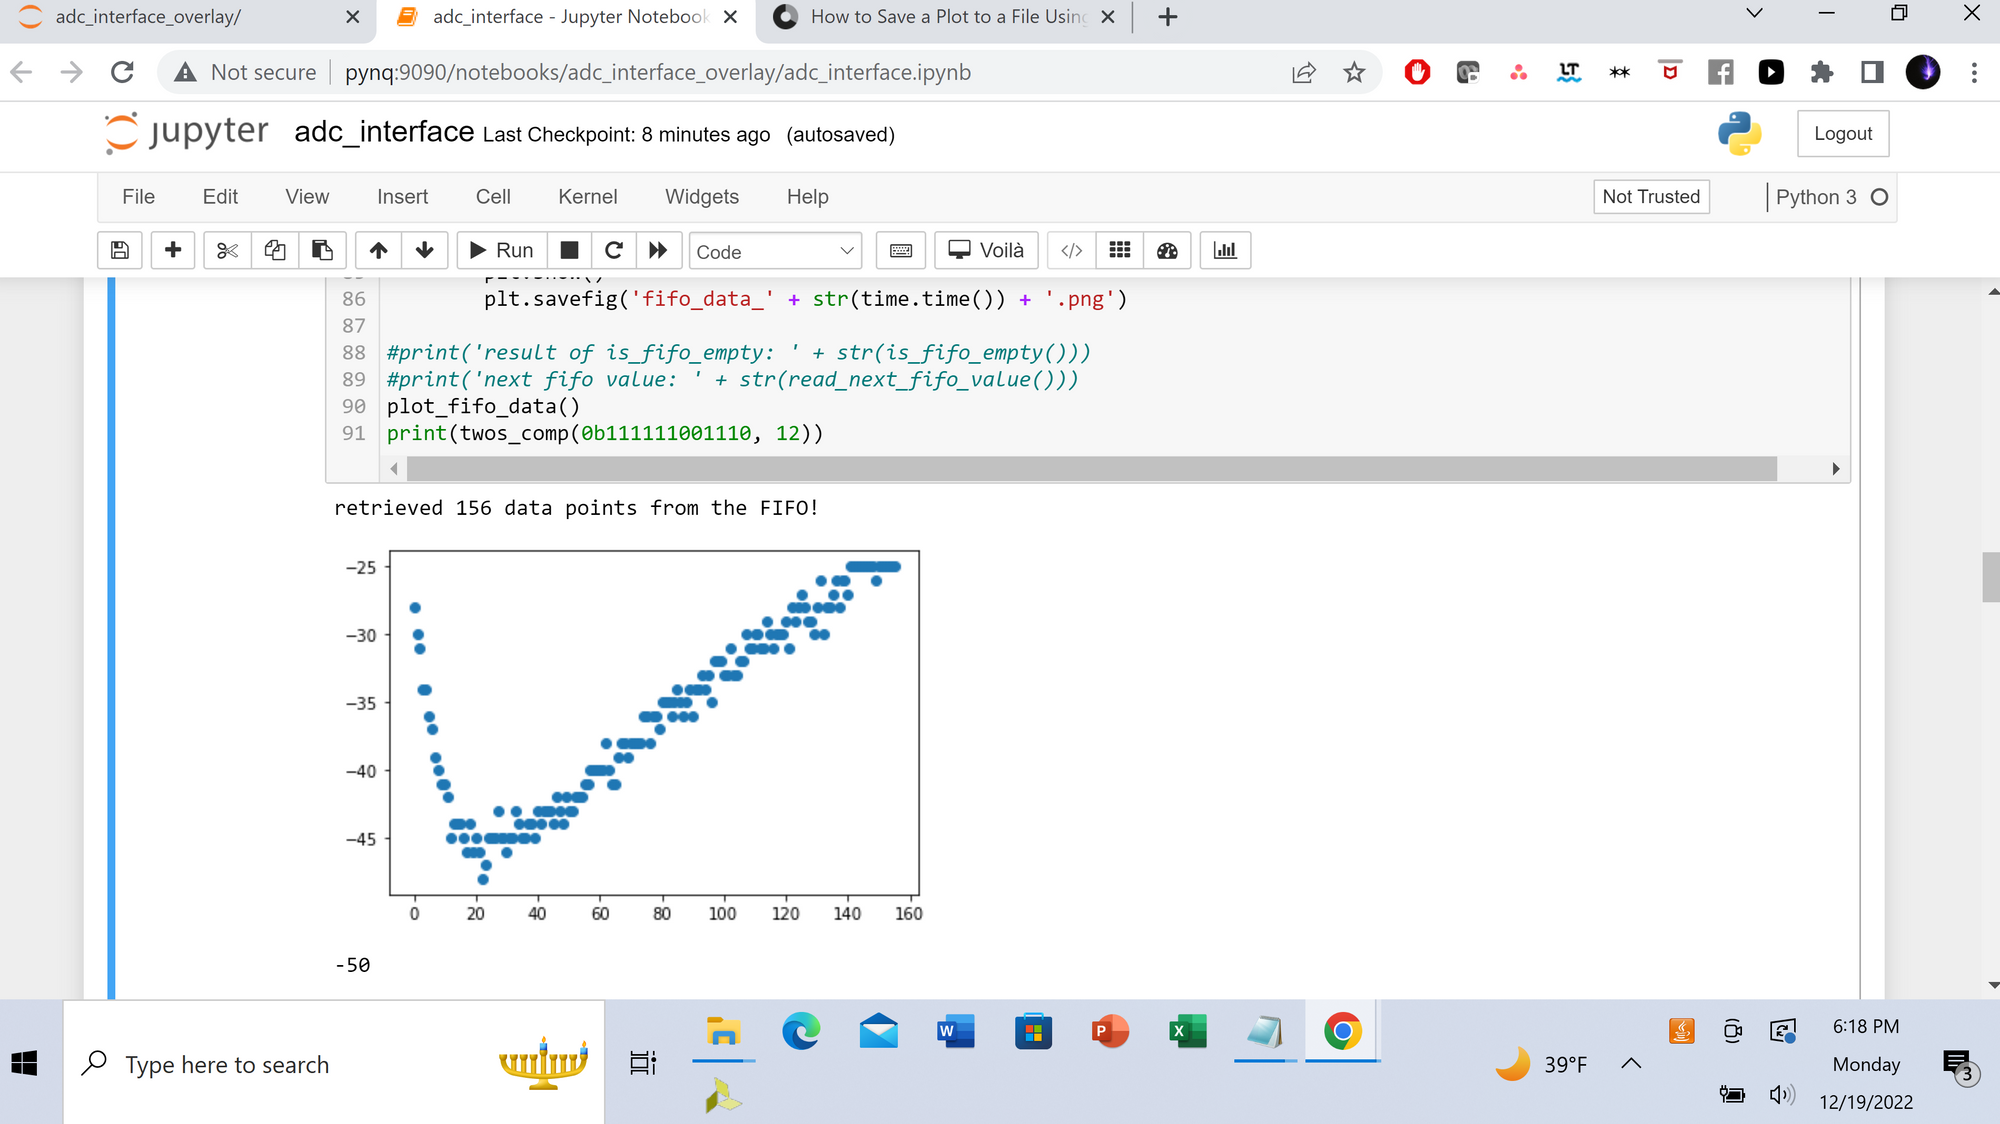
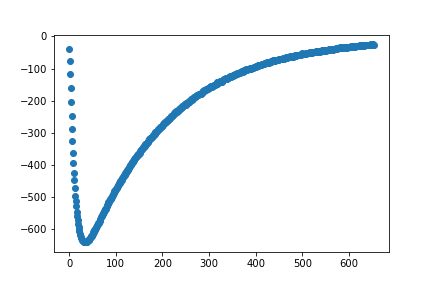
I let some more data accumulate in the FIFO, and read it out again.
This time there were a couple higher amplitude pulses that were looking quite good. I could really start to appreciate how many more samples were getting captured using the FIFO.
Continuing to ride the wave, I wrote two functions called fixed_event_count_experiment() and fixed_time_experiment() to accumulate a certain number of pulses or accumulate pulses for a certain number of seconds.
At this point, the DAQ was really in pretty good shape, at least for measurements with really low count rates like this. The handshake required to read the FIFO via the axi registers runs slow as molasses. That is, I can actually notice how long it takes to run, usually something like .5 seconds. If I were using a detector that was registering many counts per second, I'd need to work out a quicker way to drain the FIFO, or perform some data reduction in hardware to reduce the amount of data requiring transfer (i.e. boil each pulse down to a few key values such as pulse height, pulse area, a time stamp, etc.).
I also could try to implement some sort of PSD or FIR filter or something to try to reduce false counts, and I figure I might as well do that at some point just for the learning experience and because there are plenty of unused resources on the Zynq 7020. As long as I can readout the data, I can do all that in post-experiment analysis, so it isn't super pressing.
I felt good enough about everything to move on to some experiments to continue exploring the response of the scintillator as well as the Radon in the air.
Further Experiments with the DAQ System
Long Duration Pulse accumulation
The first thing I did was close the tupperware that housed the scintillator and let the system accumulate a couple thousand counts over the course of a few days. Since radon has a half-life of 3.8 days, I was expecting to see the count rate slowly drop over the course of a few days.
Unfortunately, that's not at all what I observed, and the count rate stayed pretty consistent. This probably means the tupperware isn't sealed well enough, which I guess shouldn't come as a surprise considering how little effort I put into it. I was, however, able to get a pretty good idea of what sort of noise conditions were present within the thousands of pulses I accumulated.
The first thing I noticed is that very few pulses actually looked like noise, so that was a good sign. The pulses that were pretty iffy all involved some samples that just barely made it past the threshold, so the giant high-frequency pulses I was seeing on my oscilloscope were no longer present. I'm guessing that the lower sample rate of the ADC doesn't allow enough bandwidth to pickup that noise, but there are tons of factors that could be contributing.
The vast majority of pulses fell somewhere between the following two examples.
Occasionally, the FIFO would capture some data that did not clearly contain a pulse, like below.
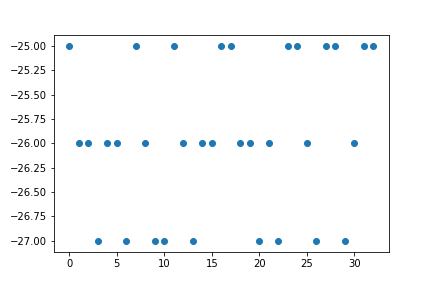
The good news was that these types of erroneous events generally didn't consist of very many samples, which means most if not all of them could be removed using a simple time-over-threshold filter. I didn't bother to implement that in hardware since I could easily do it in software using the recorded data in post-experiment analysis.
Another interesting thing I noticed was that occasionally two pulses would get recorded with very little time in between such that they would both be read in the same FIFO dump. This would be a bit harder to identify and account for post-experiment, so it might be worth trying to get the hardware event counter to be more robust so each event in the FIFO can be tagged and separated if there are more than one. These events are pretty rare though, so that's another one for the backlog.
Even though this experiment didn't yeild the results I wanted, it did give me a pretty good idea of how the system was working, and improvements I need to make. To really isolate the detector from the outside radon will likely require much more careful design and assembly of an enclosure. I plan to get around to this at some point, but there were some other experiments I was pretty confident I could do even without fully removing the radon background.
Measurement of Alpha Particles from a Low Activity Source
I figured I might as well test how well the scintillator can pick up alpha emissions from a source that I know contains material similar to what might be found at Rocky Flats.
A number of years ago I bought a small sample of trinitite on eBay. Trinitite is formed when sand/dirt fuses together during the detonation of a nuclear weapon (the name is derived from the original Trinity Test). I confirmed via gamma spectroscopy that my trinitite sample did indeed contain trace amounts of fission products such as Cs-137 and Am-241, so I knew it was genuine and certainly contained some alpha emitters. If it was actually from the Trinity Test, it might even contain small amounts of Plutonium.
While it's far larger than anything I'd expect to capture in an N95 at Rocky Flats, if I can't even detect alphas from a piece of trinitite, there's no way I'd ever measure anything from Rocky Flats.
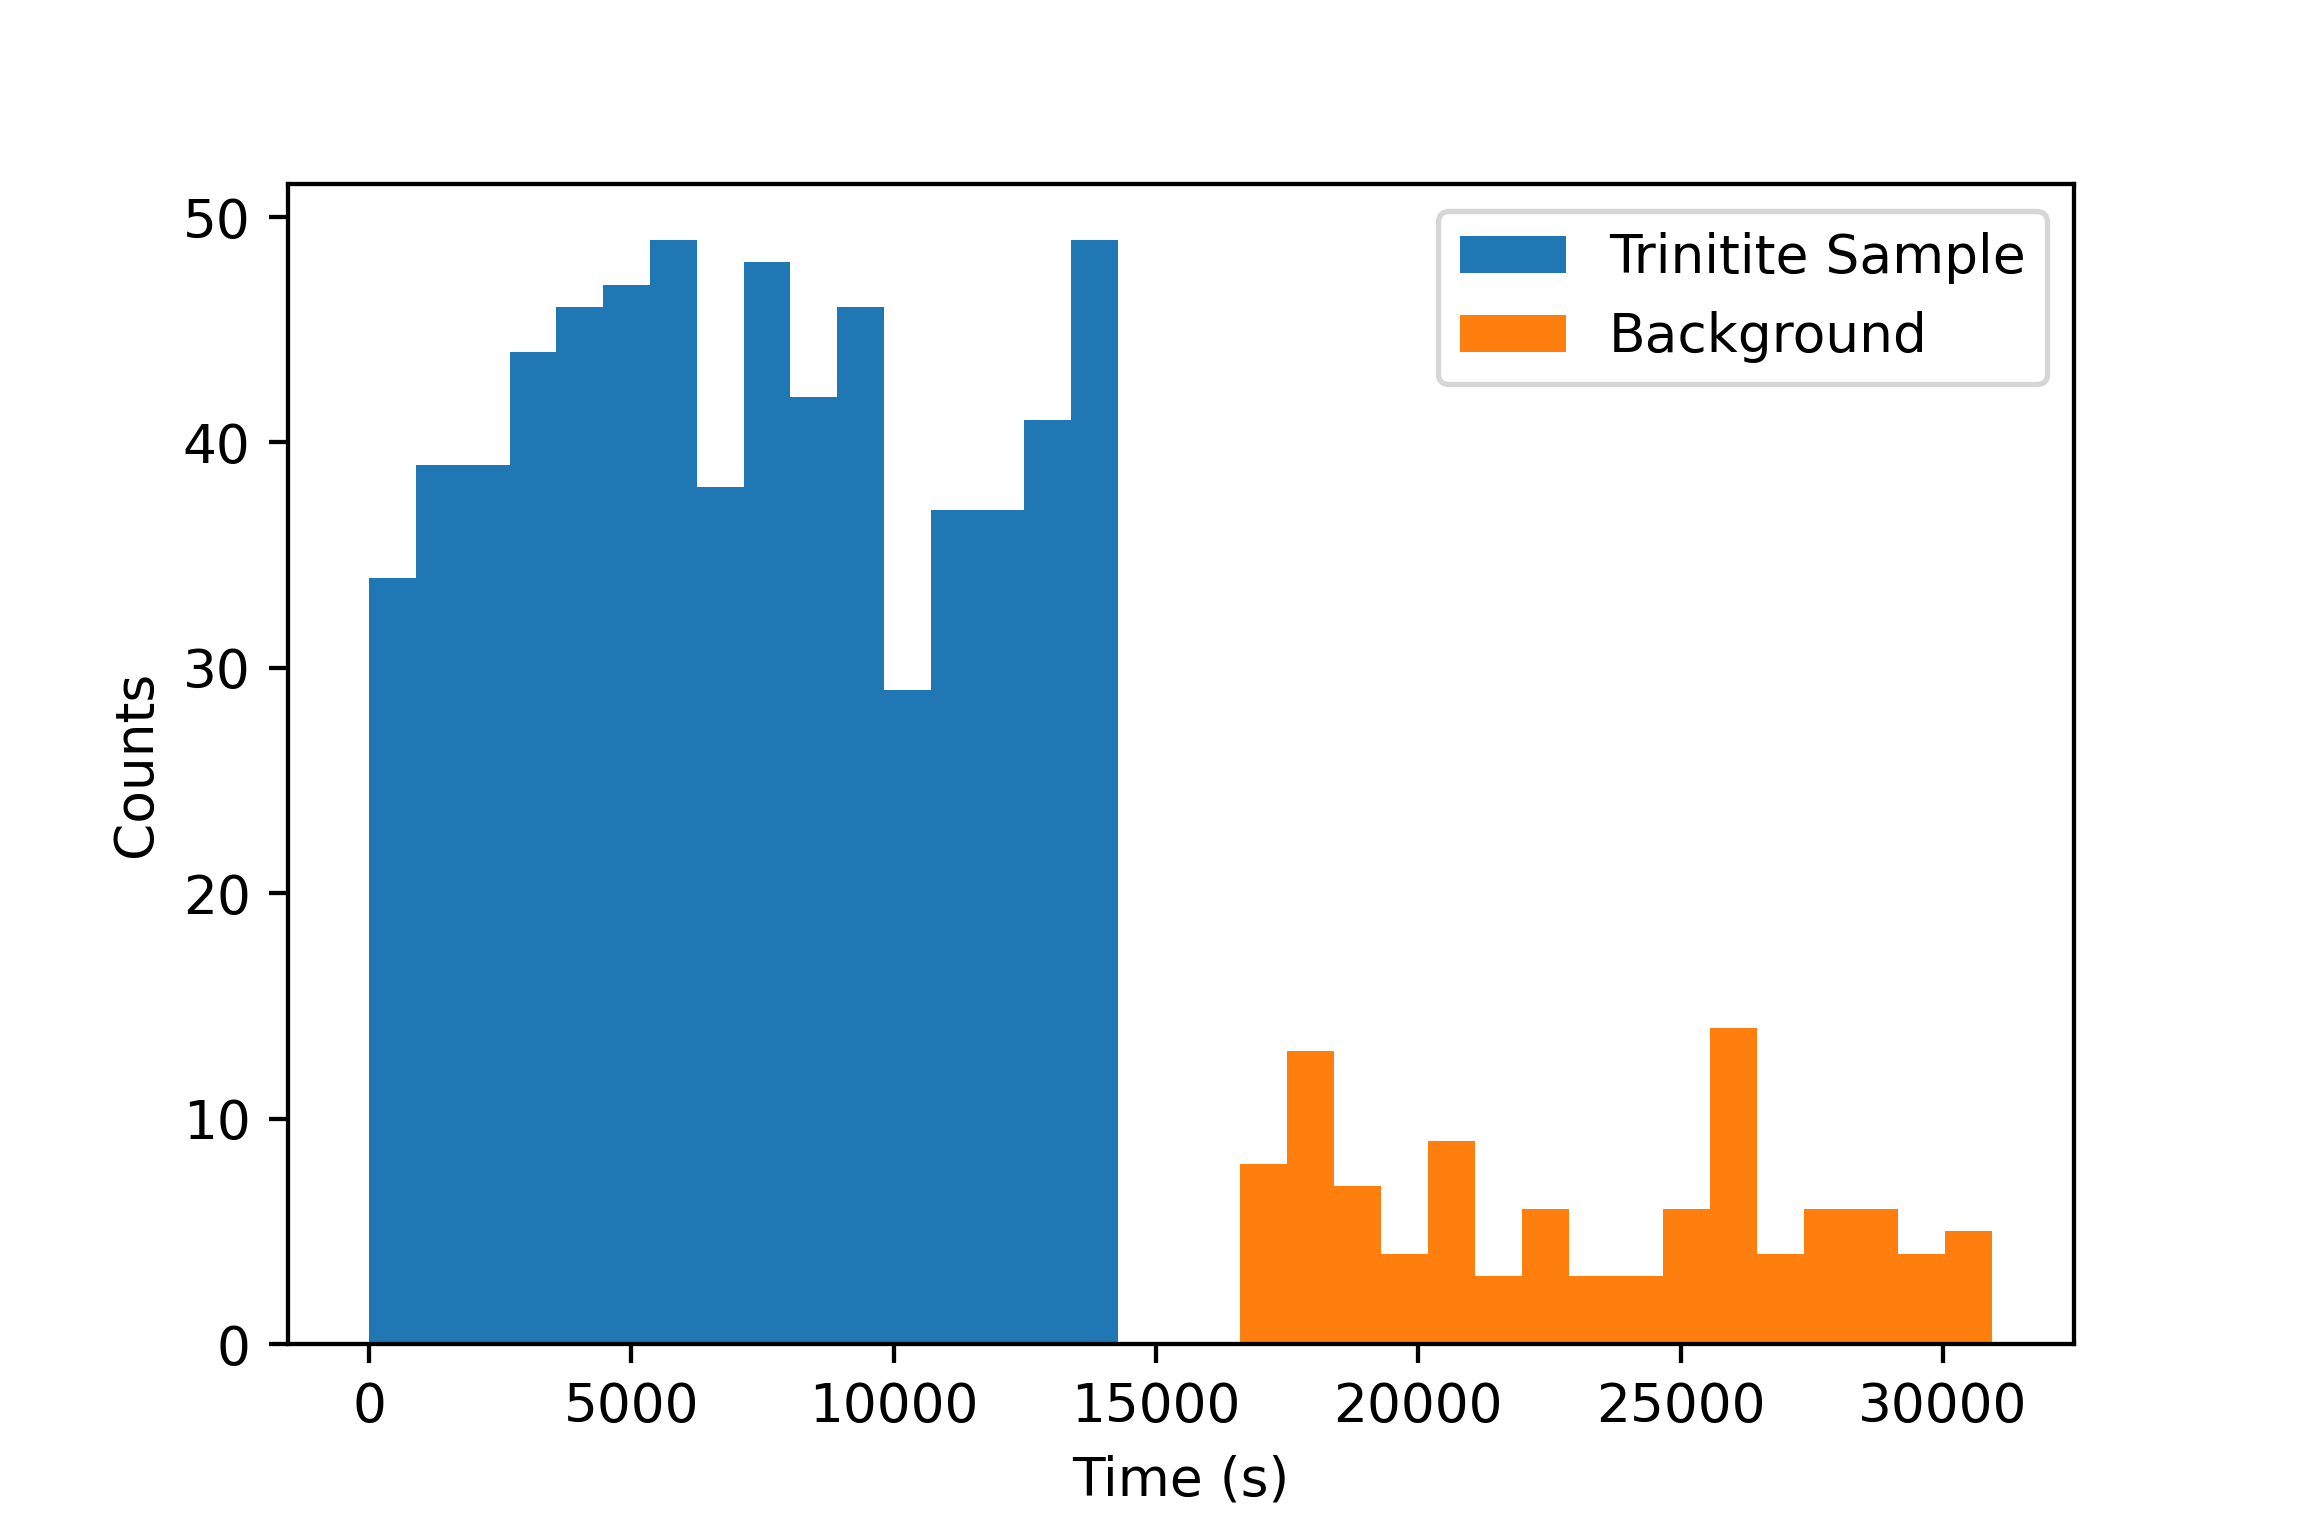
I threw the trinitite on the scintillator with some aluminum foil covering the "unused" area of the scintillator to reduce Radon background, and accumulated counts for 4 hours.
Once I completed the measurement with the trinitite, I removed it and covered the small window with another piece of aluminum foil. I performed another 4 hour measurement to get a background count.
It was pretty clear that the count rate was far greater with the trinitite versus without it, but I went ahead and made some plots anyways. The plotting script allowed me to filter out events with fewer than 50 ADC samples, which should remove most if not all erroneous pulses, though double pulses would still be counted as a single event.
I also tried plotting the pulse height spectra of the measurements to see if the scintillator could provide any information about the energy of the alphas it measured. This could be really useful for distinguishing possible plutonium contamination from naturally occuring alpha emitters in the final Rocky Flats measurement.
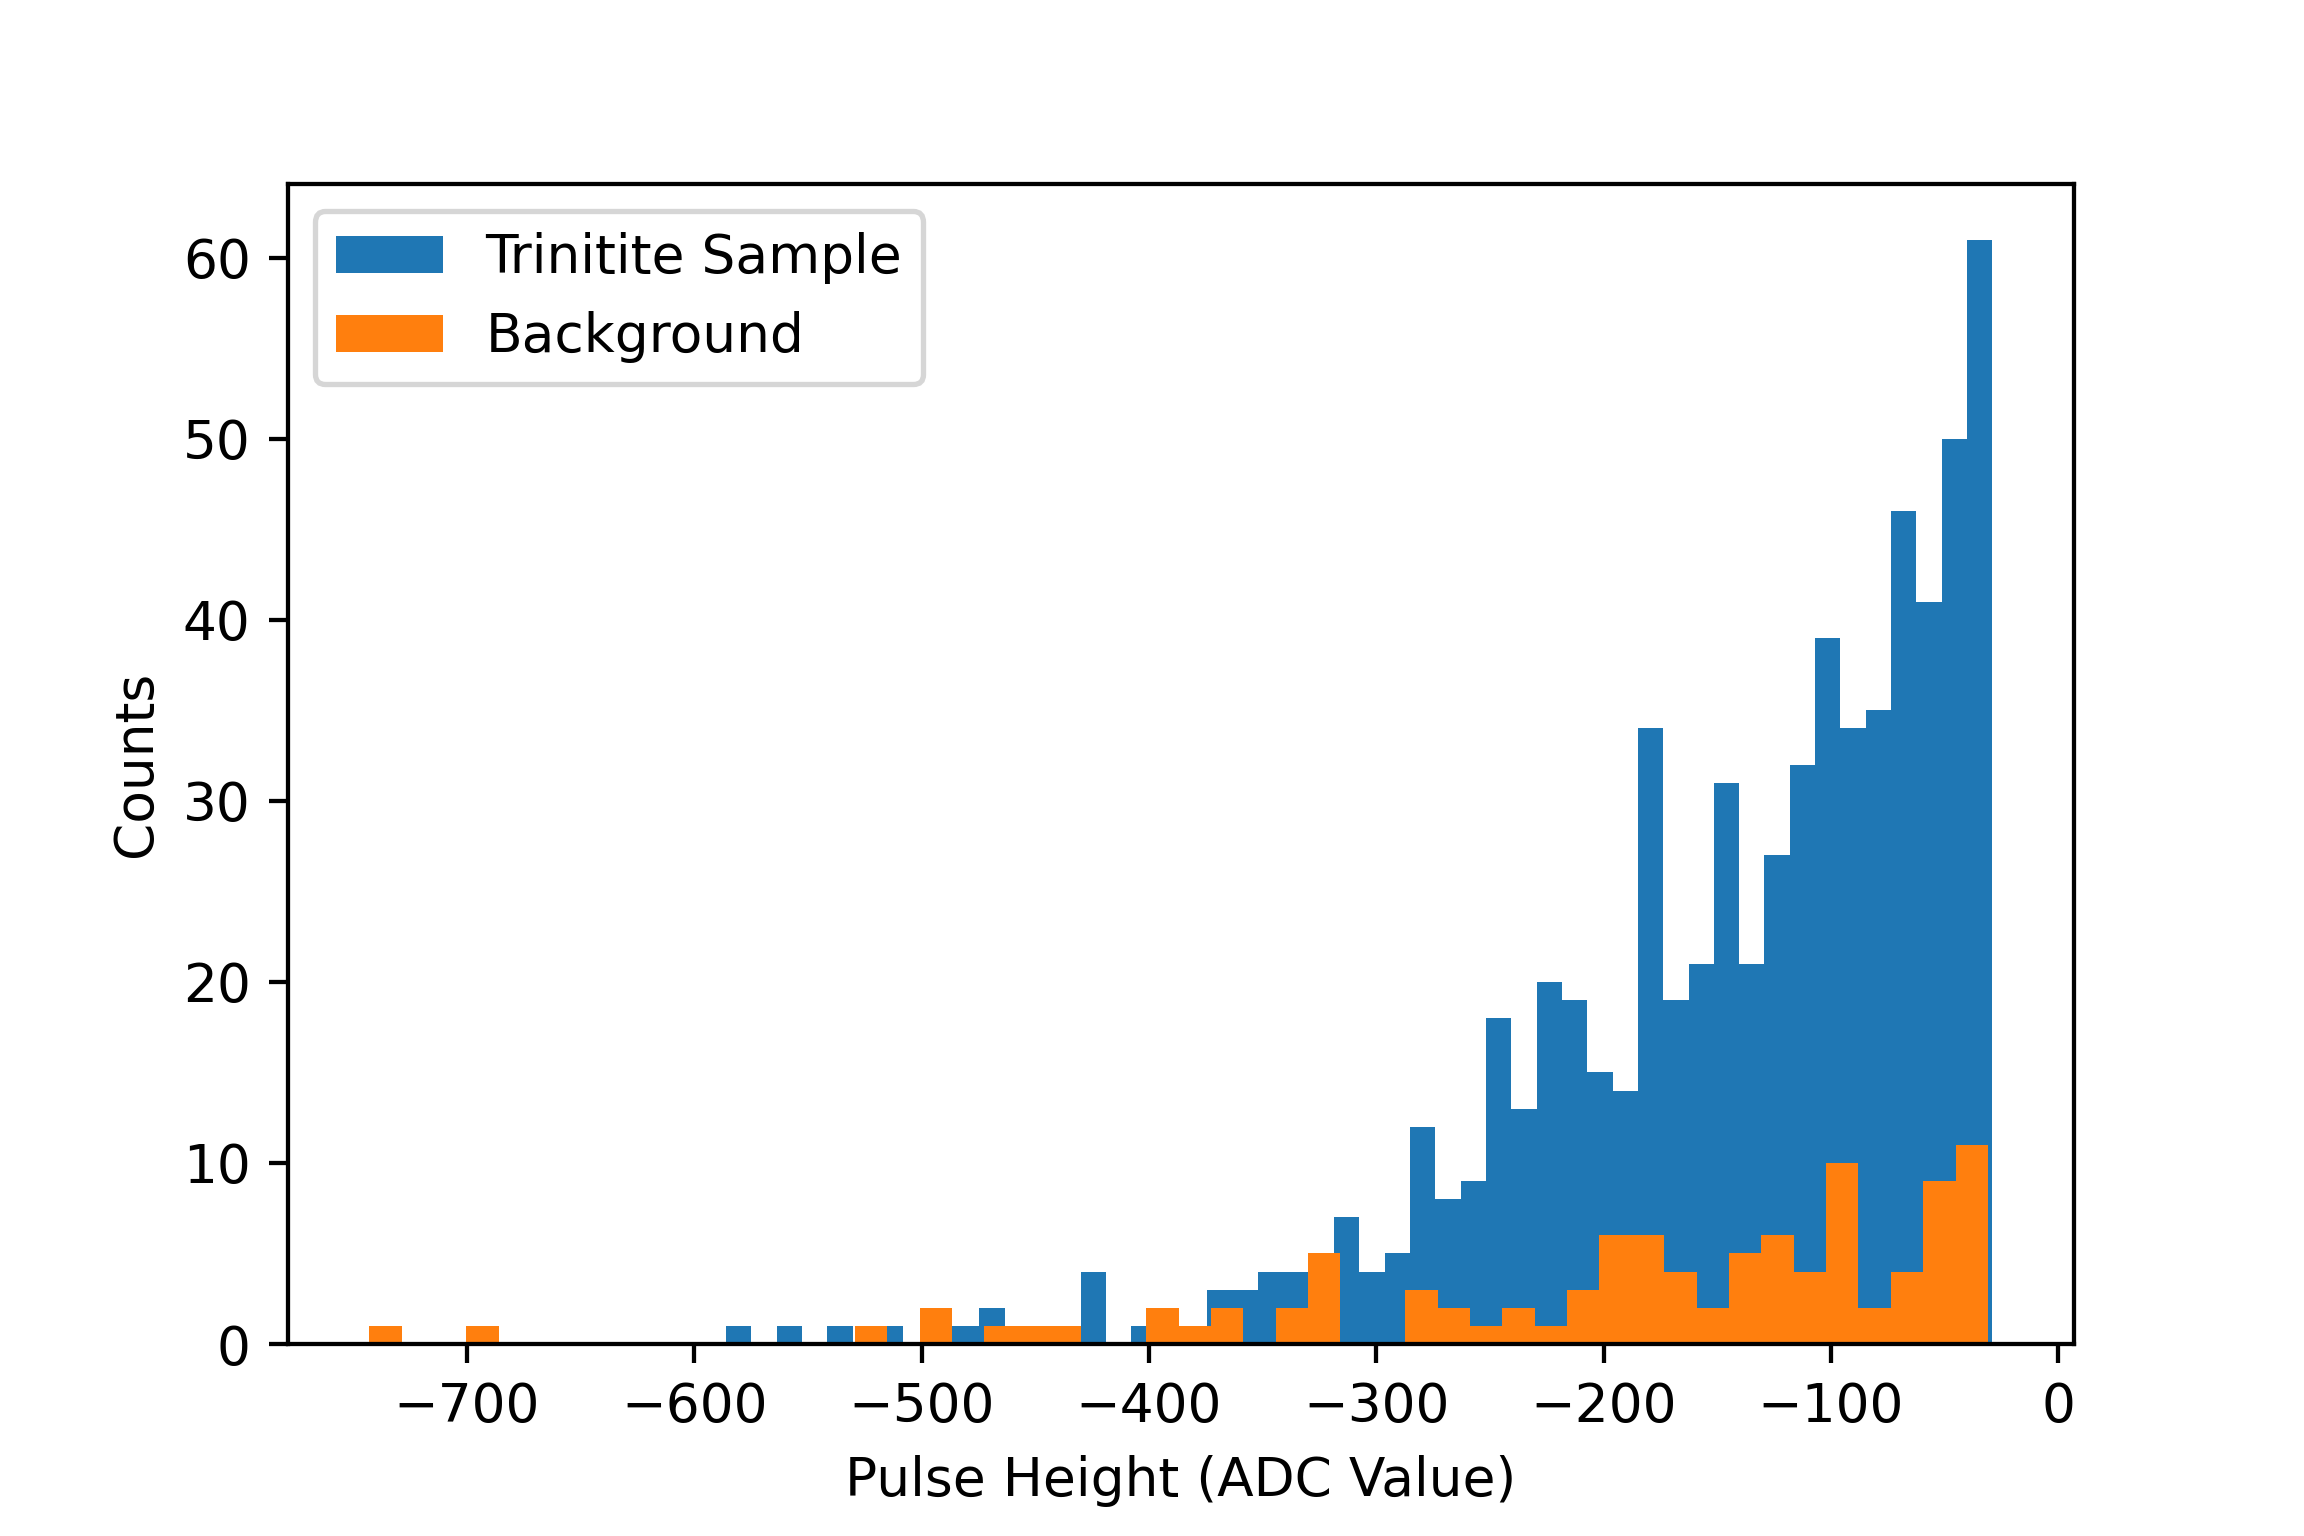
Unfortunately, no peaks were really visible in the spectrum. Part of this might be due to alpha particles getting degraded as the escape the trinitite sample and pass through the small layer of air between the sample and the detector, but there's a bigger issue. ZnS is not transparent. Thus, some of the scintillation light will get absorbed by the scintillator itself before it reaches the PMT. This smears the spectrum even more than degrading of the alpha particles. For this reason, ZnS(Ag) is generally considered a bad choice for spectroscopy, but I figured I'd confirm that for myself.
All this test really confirmed is that the detector is capable of detecting relatively weak sources. For reference, this sample barely registers above background on a gamma scintillator, so the fact that it was many times background on the alpha scintillator was pretty cool and speaks to its sensitivity. Not super useful, but still kind of fun.
Exploring Radon Decay Products
This is where I have to admit my initial measurement of radon concentration was pretty wrong. I had a feeling that radon decay products were a big contributor to the counts in my measurement but I really didn't have a good sense of just how big they might have been.
As it turns out, radon decay products are far more hazardous to your health than the radon itself. I found a nice paper by Hinrichs et al. that explains the reason why in its introduction, but I'll summarize.
Radon itself is inert and pretty good at remaining in the gaseous state in the air. So, even though you breath in a little bit of it with every breath, you'll breath it back out almost immediately.
Once the radon decays, however, it transmutes into elements that are not inert and within 1 second will react with water and other molecules in the air to form a tiny particle about 0.5-5 nm in size. Within the next 1-100 seconds these "unattached progeny" will attach themselves to larger aerosol (e.g. dust) particles in the air that are roughly 20 to >100 nm in size.
The problem is that these aerosol particles, now with radioactive radon daughters in tow, can become trapped in your lungs. This means the probability of an alpha decay from Po-218 or Po-214 striking your lung tissue is much higher than an alpha decay from Rn-222. In fact, roughly 95% of the dose absorbed from radon, is actually from radon daughters rather than radon itself.
This has a few noteable implications. One is that the radon concentration itself is maybe not the best proxy for the dose you actually absorb. If dust and aerosol levels are low and there is good air circulation and filtration, many of these harmful radon decay products could be removed from the air or "plate out" on the walls of your home before entering your lungs. It's still a very good idea to install mitigations if you have high radon concentrations, but if that isn't an option for you, there are other methods you could use to potentially reduce the dose you absorb from a given radon concentration (disclaimer: I'm simply trying to relay some interesting facts. You should still listen to the advice of experts rather than me.). This is also the reason why the fact sheet from the CSU extension listed risks for smokers and non-smokers separately, which I didn't fully understand before. Smoking in your home greatly increases the concentration of aerosols in the air, which greatly increases the likelihood of radon decay products finding their way into your lungs on those aerosols. For that reason, smoking and exposure to second-hand smoke greatly increases the risk associated with Radon (in addition to carrying its own cancer risks). I imagine smoking exclusively outside could change that picture a bit, but that's mostly speculation on my part. I don't think it's controversial to say that it's probably better just to refrain from smoking altogether.
More importantly for me, however, this means there might be naturally occuring radioactive dust floating around just about everywhere that could interfere with my intended Rocky Flats measurement.
The main point of the Hinrichs et al. paper was to demonstrate that the sort of masks used during the COVID pandemic are also effective at trapping aerosols containing radon decay products, so this could actually be a pretty good test run for the methods I wanted to employ at Rocky Flats, and I could do the experiment in the comfort of my own home.
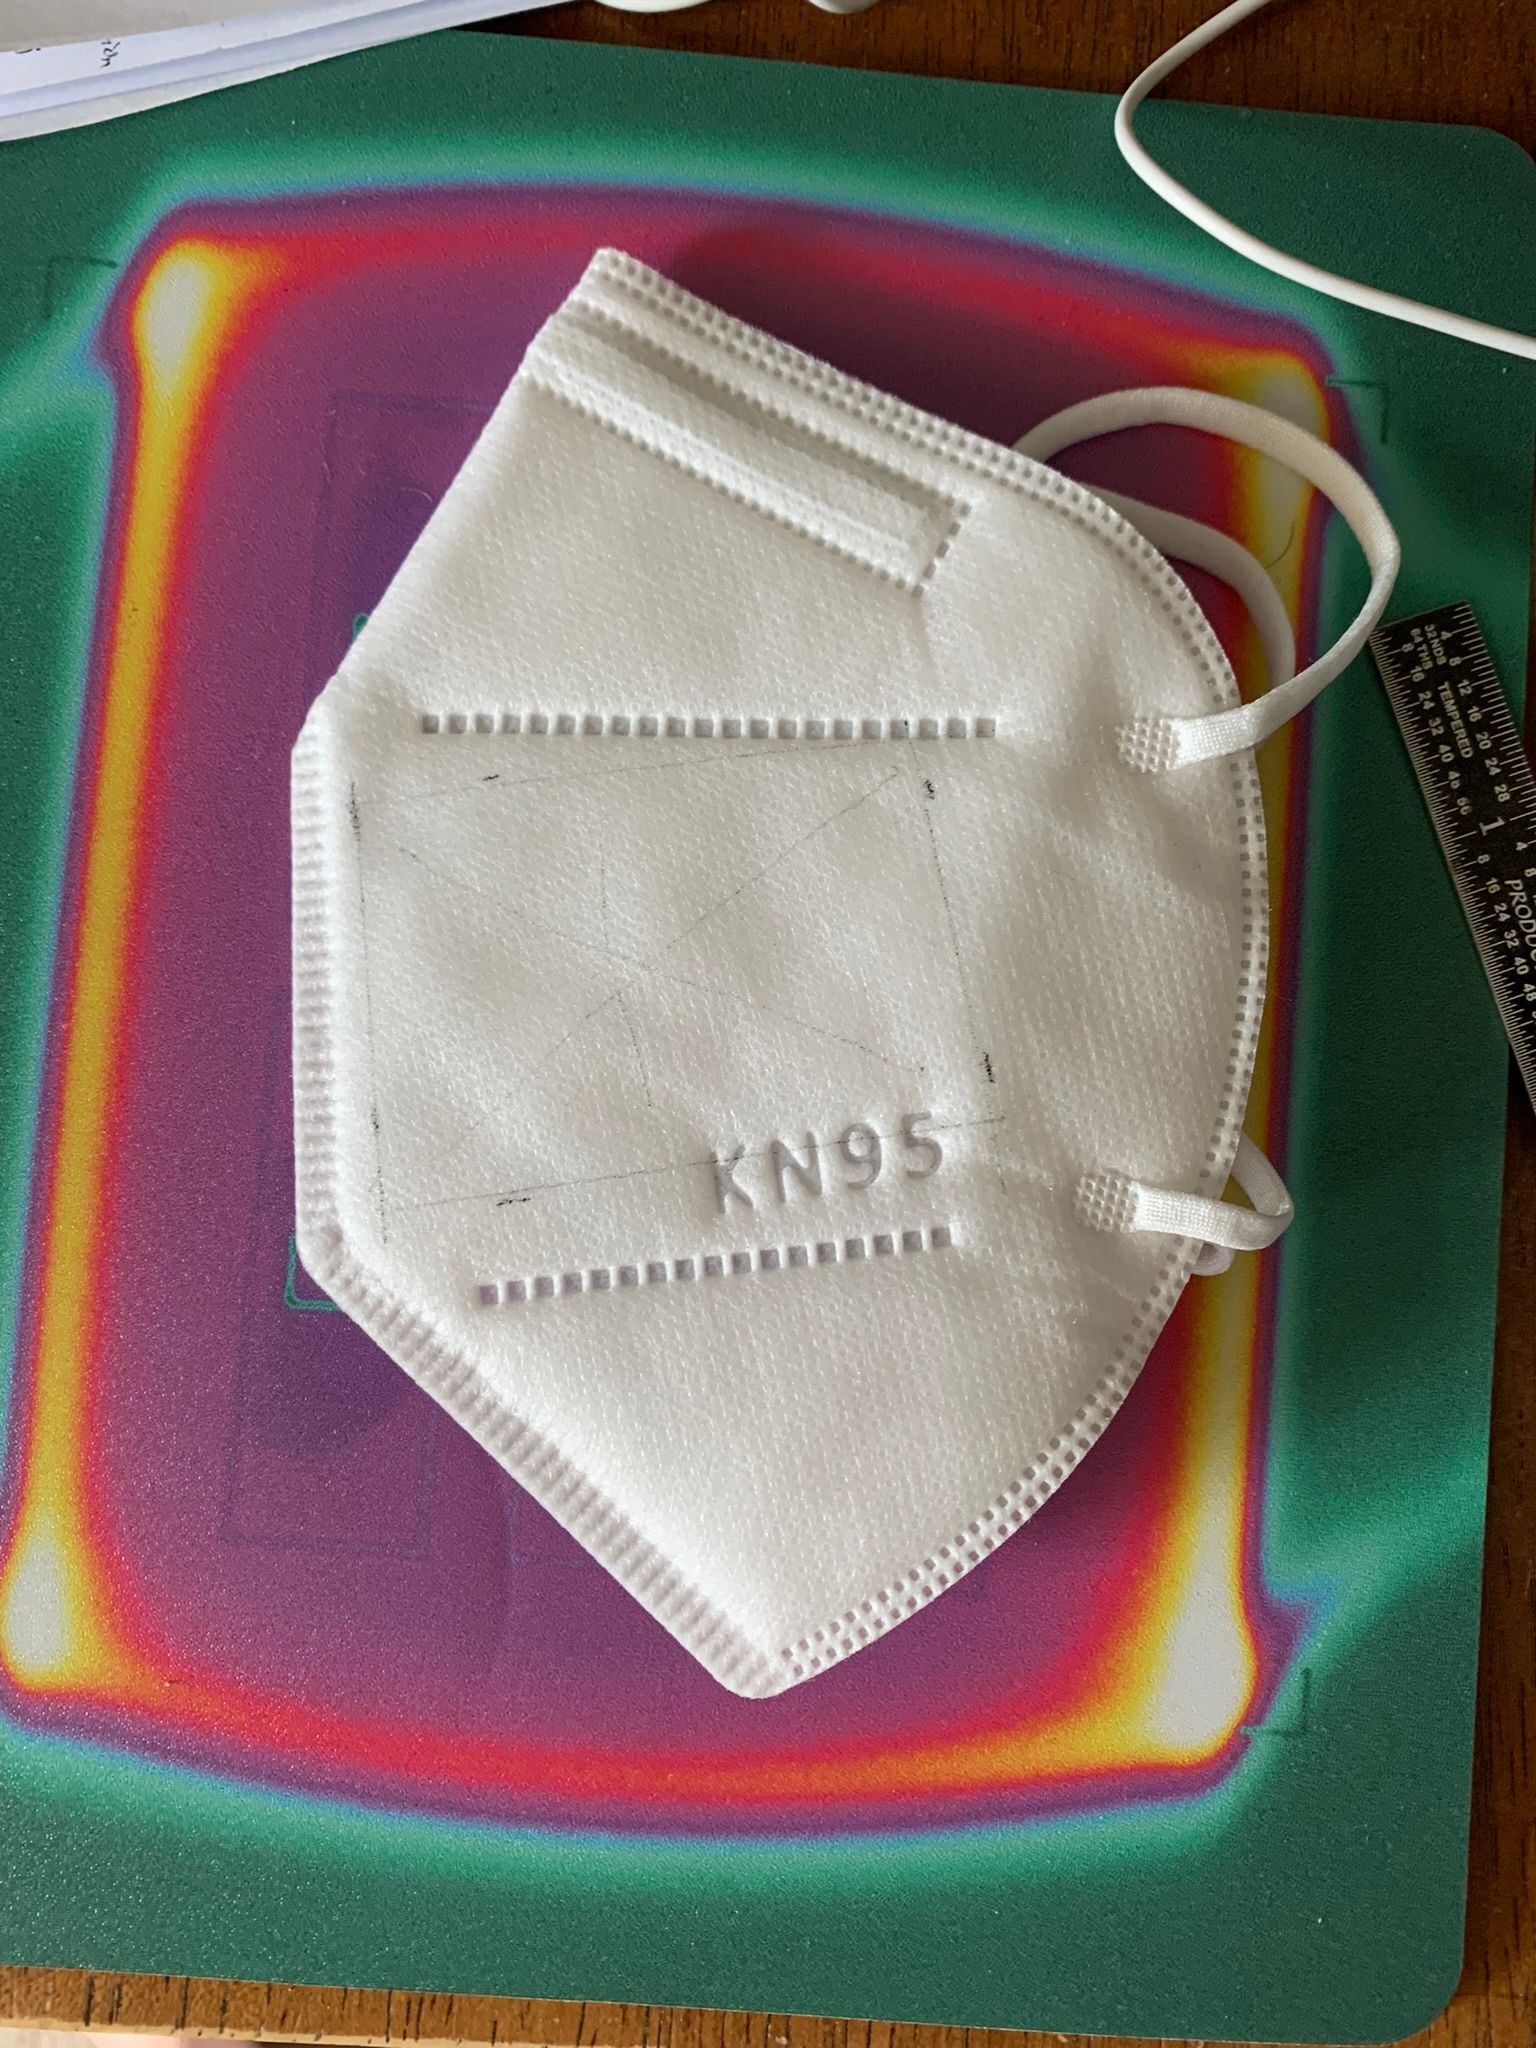
To do this experiment, I simply wore an N95 mask for about 7.5 hours while I was sitting around my apartment one day. The hope was that some amount of dust with radon decay products would get caught in the mask simply from me breathing through it. In reality, I probably didn't need to wear the mask for so long since the radon progeny of interest (from Po-218 through Po-214) won't stick around for much longer than a couple hours, but it shouldn't hurt anything.
I had marked out an area on the side of the mask that roughly matched the dimensions of the alpha scintillator, and cut that area out following the "sample collection period." I affixed the cutout section of mask to the scintillator with masking tape, making sure the outside of the mask faced the scintillator.
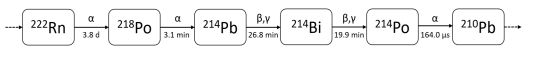
Roughly 3 minutes elapsed between removing the mask from my face and beginning the data acquisition, which means about one half-life worth of Po-218 was not captured by my measurement. This also means it's reasonable to say that Po-214 was the primary nuclide being measured in this experiment.
Because Po-214's half-life is so short compared to Pb-214 and Bi-214, we can say that it is in "secular equilibrium" with its parent nuclide. Basically, that just means the amount of Po-214 is proportional to the amount of Bi-214. So, if we really are measuring Radon decay products that were captured in the mask while I was wearing it, we would expect to see the alpha counts (with background subtracted) to drop off with a half-life of roughly 45-50 minutes (the combined half-lives of Pb-214 and Bi-214).
I measured the sample for 4 hours, to fully capture a few half lives. To get a background, I dissected an unworn mask in an identical way to the sample mask, taped its cutout to the scintillator, and measured it for 4 hours before the sample measurement. To verify that opening the Tupperware and/or placing the mask cutout on the table for a few seconds didn't skew the results, following the sample measurement, I removed the mask cutout from the detector, set it on the table for about 30 seconds, and then placed it back on the detector and repeated the 4 hour measurement. This just confirms that anything I did to setup up the experiment other than wearing the mask didn't impact the count rate. In theory, the repeated measurement should just look like an extension of the last hour or so of the main sample measurement.
When all was said and done, these were the results:
Basically, these results are exactly what I would have expected if there were radon daughters being trapped in the mask while I was wearing it.
A few take-aways from this experiment (both good news and bad news):
1) This confirms that it is possible to measure small amounts of radioactive dust trapped in an N95 mask using an alpha scintillator. So, my methodology for the Rocky Flats measurement isn't totally crazy.
2) While the background from unused masks was always similar, (around 25-30 counts/hour), it could vary from mask-to-mask enough that it could easily throw off a long-term measurement. Thus, it might be better to to use the same mask for the background measurement by measuring it before wearing it at Rocky Flats. This means I'll need to measure it without destroying it in the process. It also means that getting a better sealed container to really isolate the detector from variations in radon concentration will probably be important. Both of these points mean I'll need to redesign and rebuild the container that houses the detector.
3) This confirms that I am inhaling radioactive dust just by sitting around my apartment and writing code. So, simply going anywhere outdoors is likely to significantly reduce my dose even if the place I choose to go is Rocky Flats. This means the whole Rocky Flats measurement might be kind of a moot point, but that doesn't mean I won't do it anyways. Also, since I can't do spectroscopy with my scintillator, this means there will be no way to tell if a positive result at Rocky Flats is from plutonium contamination or naturally occurring sources (e.g. Th-232 or U-238 within regular dust/dirt, or even radon progeny from further down the decay chain like Po-210).
So that really took me down a rabit hole of my own morbid fascination with the nuclear science of Radon. I feel a little disturbed knowing that I am demonstrably inhaling radioactive material basically all the time, even though I know the levels are relatively low. Still, it was a pretty interesting experiment that taught me a lot more about radon in the process. Maybe I'll be able to use that knowlege to make something that's actually helpful one day.
Future Tasks
Now that I've essentially turned my pynq board into a crappy oscilloscope, I have all the data acquisition features I really need for my alpha scintillator experiments. I still want to add some sort of FIR filter or something to reduce the noise coming out of the ADC a little further. Mostly, this would be a good learning experience and might reduce the number of erroneous pulses even further or make the hardware event counter more useful. Plus, it would help convince me that this project benefitted at all from using an FPGA.
I need to improve the air-tight container that houses the detector both so that it's actually air tight, and so that there's enough room to affix an N95 to the scintillator window without having to cut it to pieces. Confirming that I can actually measure radon decaying away with a 3.8 day half-life in a sealed container will allow me to do measurements with even lower background, and help confirm that background is not actually coming from contamination on the scintillator whindow, which I'm a bit concerned about.
All that said, this project is really close to wrapping up. It has really gotten the gears turning in both the EE and nuclear science sides of my brain, which has been really great. Not to mention, it's given me some inspiration for possible future projects around real-time radon measurement/monitoring, and it's given me a lot of confidence and direction for a portable gamma spectrometer I've been dying to build for years. I did find out my apartment is a bit of a health hazard, which kind of sucks, but knowledge is power, as they say.
I'm beginning to think the Rocky Flats experiment might be pretty inconclusive and that this alpha scintillator maybe isn't as perfect for that measurement as I originally thought. Conclusively checking for contamination might require a spectroscopic measurement to confirm you aren't simply measuring naturally occuring materials, but even then, getting sufficient statistics to form a spectrum with such a low-activity sample might be untennable. I figure I still might as well give it a go though. Simply experimenting with the radon alone has been interesting, so I can only imagine how experiments out in the wide, wide world will go.